Databases as we know them have been around for over 40 years. When they first came about businesses would often keep data in separate systems and separate formats. There were a variety of reasons for these decisions. One of the side effects of these separate data stores is the need to combine together to be able to perform data analysis. This led to the long-standing practice of ETL, or Extract, Transform, Load.
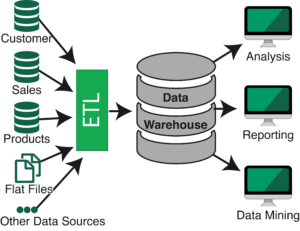
ETL is a process to extract data from a starting data source, transform the data in some fashion, then load it into another data store. Sounds simple enough, but in fact, there is a lot of work going on under the covers and a lot of steps and decisions to navigate. These additional steps reduce the speed at which we can get meaningful insights from our data. Further, they rely on many assumptions about transforming data into what is assumed to be the correct format for later consumption – without knowing very much about the business questions to be asked of this data down the road.
From Data Warehouses to the Cloud
Traditionally, enterprise applications have relied on performing ETL operations to move data into an enterprise data warehouse (EDW).
Creating a successful data warehouse can be a long, complicated, and expensive process. One of the technologies that have been created to help with the process is Apache Hadoop. Hadoop allows for the processing of massive amounts of data on commodity hardware with open source technologies. However, instead of simplification, the ETL and data warehousing landscape has only become more complex and cumbersome and the proliferation of tools combined with maturity and adoption issues have only increased the cost. Further, according to Gartner analyst Nick Heudecker, 85% of big data projects fail. Mostly due to the complexity of the process itself.
With the transition to the cloud many organizations are undertaking, ETL becomes even more complicated from a meaningful and timely data analytics standpoint. Moving data from one source to another takes time. Now there is hidden data transfer and compute costs and latencies to navigate. While some meaningful analytics can be performed on stale data, most modern analytics need to be as close to real-time as possible.
Issues WITh ETL
A few of the problems that we are faced with when setting up ETL processes are:
- Latency & Downtime – There is an inherent cost of moving data from point A to point B. Forty years ago, when ETL started, we were working with megabytes of data and not needing “instant” access. Today we’re dealing with terra or petabytes of data and needing real-time insight from that data.Moving data across the network isn’t free. On a 100 BaseT network, transferring one gigabyte of data takes 100 seconds. A terabyte takes 10,000 seconds or over two and a half hours. All assuming that it’s on a dedicated network that isn’t used by other applications. At ETL demands grow, data could easily be stale by many hours.We used to be able to schedule these transfers during “downtime” at midnight. However, in today’s global world, users are always online somewhere demanding instant access and insight. Downtime is simply no longer acceptable and latency has become the new downtime. Should suppliers on one side of the world suffer from poor performance just so executives on the other side of the world have up to date dashboards in the morning?
- Storage is cheap, labor is expensive – Data warehouses started at a point in time in which storage was expensive. In 1981, one gigabyte of data storage cost about $290,000. Today that cost is under $0.10. It was, therefore, important to transform and compress as much data as possible when storing to save costs.As storage costs have decreased, labor costs have gone the opposite direction. Having a good database administrator to design, manage, and maintain your data warehouse and ETL path is expensive. Storing raw data is frequently seen as a more economically viable choice.
- ETL is hard – ETL takes planning. Lots of it. And not just for your current load of data, but for what might happen to the load down the road. Additionally, ETL scripts can get long and complex.Bringing in data from a variety of sources, looping over them, adding logging, error handling, configurations are just the start. Determining how the data needs to be transformed can be complex, and fragile. What happens if data stored today as a string gets changed down the road? The process breaks and adjustments need to be made.Do you ever wonder why the first answer out of a DBA’s mouth is an emphatic “No!” when asked if something can be changed? One “simple” change can mean changing dozens or hundreds of lines of code. For these reasons and more, ETL requires planning for current and future data needs, loads, and shape.
- Are developers the right people to build the ETL pipeline? – Developers are great at many things, however, knowing about data storage and ETL pipelines aren’t often one of them. ETL design and implementation are typically best done by data engineers. While a developer may be able to get data through an ETL pipeline and into a data warehouse, generally speaking, it often isn’t done in the most efficient manner. Specialized data engineers should be responsible for these tasks. If you don’t have them on your team, this is another cost of ETL.
- Maintenance headaches – As the size and complexity of data, applications, and analytics requirements grow, so does ETL maintenance. Maintaining changes in data velocity, formats, connections, and features takes time. Many of these challenges may not be thought of at the start of a project, but lead to long-term maintenance needs.
Use MongoDB Charts to Avoid the Headache of ETL
Companies today still have data in a variety of systems. In certain instances, ETL is the only option to be able to perform visualization and analysis of your data. Or, perhaps, you’ve explored ETL but haven’t taken the steps needed to get your data ready for analysis because it’s overwhelming.
If you’ve leveraged MongoDB as your database, the need for ETL procedures has been dramatically reduced with the introduction of MongoDB Charts, now in beta. MongoDB Charts natively understands the MongoDB Document Model allowing for the rapid creation of data visualizations over your data.
With MongoDB Charts you can connect to your MongoDB server, assign user authorization policies to your reports, and easily generate visualization dashboards. With over a dozen different chart variations to choose from, stunning visualizations are just a few clicks away.
MongoDB Charts allows for data to be visualized without performing ETL operations, saving valuable time and resources. You don’t need to write any code or rely on third-party tools. Further, you still get to leverage the richness of the Document Model.
Conclusion
For those situations that you want to quickly access your MongoDB Data, MongoDB Charts is a terrific option. If you’re in a situation that requires multiple data sources to be analyzed, we offer the MongoDB Connector for Business Intelligence. If you are doing advanced analytics with Apache Spark, we have an option for that as well with the MongoDB Connector for Apache Spark.
For many roles in an organization, MongoDB Charts is a great tool for analyzing your data. There’s no need to go through the pain of the ETL process. It is the fastest way to build visualizations over your MongoDB Data, wherever it’s stored. On-premise or in the cloud hosted by MongoDB Atlas. Give it a try today!
This post was originally published on the MongoDB Blog.