MongoDB Horizontal Scaling through Sharding

There comes a time in many MongoDB database, or any database for that matter, life cycles in which our data outgrows our servers. Either physically outgrows storage capabilities or the data grows so large that performance is degraded. Even scaling our physical servers up with a more powerful CPU, more RAM, or hard drives (vertical scaling) may not be enough. This is where horizontal scaling through sharding comes into practice.

Sharding

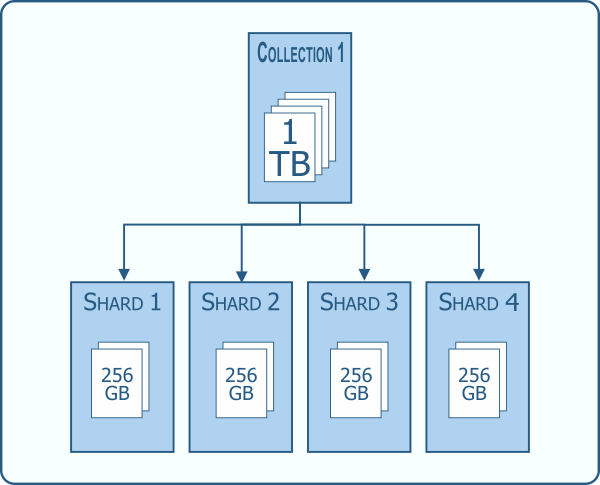
What is sharding exactly? It is the practice of distributing data across multiple machines. In MongoDB it supports instances with large data sets and needed high throughput operations. The data is distributed across all shards allowing the workload to be evenly shared. This has the potential for much better efficiency than a single server.

Sharded data distribution example

Each cluster should, for redundancy, also be replica sets with primary and secondary servers.

Sharded Cluster Example

MongoDB data is sharded at a collection level, therefore it isn’t necessary to distribute the entire database across a sharded environment.

Cluster Configuration

There are three components to a sharded cluster that we need. We need the shards themselves, a query router in the way of a mongos server, and configuration or config servers.

The shards are what store the subset of the data. The config servers store all of the metadata about the cluster and which shard houses what data. Data is stored in chunks on each shard and the config server keeps track of all that information.

The mongos, in its role as a query router, acts as the interface between the application and the data. It routes queries and write operations to the appropriate shards. An application, therefore, will only access the data through a mongos, never by touching the data itself. Queries are routed via the mongos to all shards unless it can be determined the data resides on a particular shard.

Broadcast Sharding

There has to be a better way than broadcasting that request to all shards though, right? As you might imagine, this “scatter/gather” approach to querying can result in some long running operations. Well, I kind of eluded to it before by qualifying it with the “unless”, so there is a better way! Enter the shard key.

Shard Keys

A shard key determines how documents in a collection are distributed across the shards. It is an indexed field, or indexed compound fields, that exists in every document in the collection. Recall that MongoDB allows for a flexible schema within the document model. This is one consideration when choosing a shard key; every document must have the indexed field.

If provided with a shard key during a query, the mongos knows how to route the request.

Targeted shard query

This can greatly enhance performance. Choosing a good shard key, however, is very important. I’ve covered what goes into the selection of a good shard key in a different post.

Trade offs to Sharding

As the saying goes, there’s no such thing as a free lunch. Sharding is the same way. Sharding your data sets increases infrastructure complexity as well as maintenance. One solution to help mitigate both of these is to utilize a DBaaS such as Atlas to host your MongoDB data.

If queries are run without including a shard key, the “scatter/gather” approach is used. This can result in slow queries, therefore it is definitely something to remember when writing your applications.

Once a collection is sharded, it cannot be unsharded. Similarly, once a shard key is selected, it cannot be changed. So these steps need to be undertaken with careful planning.

If you are handling things yourself on your own hardware I have briefly discussed some of the tools which can be used to check performance of a sharded collection in previous posts. Specifically in MongoDB CLI Tools and briefly in MongoDB explain() explained.

Wrap Up

When your data has outgrown a single server, sharding is a great approach to keep your database performing well. There are some things to watch out for though. Make sure you choose a good shard key and stay up to date with database maintenance.

There are a lot of MongoDB specific terms in this post. I created a MongoDB Dictionary skill for the Amazon Echo line of products. Check it out and you can say “Alexa, ask MongoDB what is a Shard?” and get a helpful response.


Follow me on Twitter @kenwalger to get the latest updates on my postings.

Facebooktwitterredditlinkedinmail

MongoDB explain() explained

There are many different considerations to be made when running queries in MongoDB. A helpful thing to use in the mongo shell when running a find() operation is to use the explain() method. In this blog post, I’ll take a look at some of the options for explain() and what the results mean.

explain()

As discussed in a previous post on indexing in MongoDB, we can use the explain() method to learn about the selected query plan. This allows for an examination of the performance of a given query. It can be used in the following manner:

db.collection.find().explain()

The information generated can be used to see what index is being used for a query, if the query is a covered query,  and which servers in a sharded collection the query is run against, to name a few.

Three different verbosity modes can be utilized to determine the amount of information provided.

Verbosity modes
  • queryPlanner – the given query provided in the find() method is put through the query optimizer to find the most efficient query. This “winning plan” is then passed to the queryPlanner and the information is returned for the evaluated query. The query is not run in this mode. As a result things like query time, e.g. executionTimeMillisEstimate are true estimates since the query has not been executed.
  • executionStats – when running in this mode, the query optimizer is run and the query is fully executed. The information returned details the results of the are what actually happened during that specific query.
  • allPlansExecution – as the name might suggest, this mode returns information about all possible query plans. While the winning plan is executed and statistics returned for it, other candidate plan information is returned as well. This is the default mode of explain().

The variety of information these different modes provides can be extremely useful. Let’s take a look at some returned results of explain() and walk through what they show.

Results

For this example, I will use a test example database of a blog. The database contains two collections, users and articles, and is running on a single, unsharded, machine. Each collection has, roughly, 550,500 documents and is not indexed beyond the index for _id.

Let’s start with looking at what gets returned from a query for a single username. And take a look at some of the bits and pieces of information provided.

db.users.find( { "username": "User_9"} ).explain()


explain output

The parsedQuery section is the query we are exploring. The query stage provides a description of the type of operation that occurred for the winning plan.

Operation Types

  • COLLSCAN – indicates a collection scan occurred for the query, meaning that the query looked at each document to get the results
  • IXSCAN – indicates an index was used for the query
  • FETCH – for retrieving documents
  • SHARD_MERGE – the result of merging data from shards

The stage is a tree structure and can have multiple, child, stages. The direction of the query shows whether the query was performed in a forward or reverse order. The serverInfo section displays information on the server the query was run against and includes, in the version key, the version of the MongoDB database. If the collection was in a sharded environment, each accessed shard would be listed in the serverInfo.

When the command is run using the “executionStats” verbosity mode:

db.users.find({ "username": "User_9"} ).explain("executionStats")

additional information is provided as a result of the query being run on the data.

explain with executionStats

Here we see, among other things, the time the query took to run, along with how many documents were returned, nReturned, and how many documents were examined by the database, totalDocsExamined. As mentioned in my post on indexing, ideally these two numbers should be very close to the same value.

Wrap Up

There is a lot of information available when using the explain() method. It provides some great information about how queries are actually being run and gives an indication as to where a collection can benefit from an index. It should be your first stop when examining slow queries before moving onto other MongoDB tools.

There are a lot of MongoDB specific terms in this post. I created a MongoDB Dictionary skill for the Amazon Echo line of products. Check it out and you can say “Alexa, ask MongoDB what is an index?” and get a helpful response.


Follow me on Twitter @kenwalger to get the latest updates on my postings.

Facebooktwitterredditlinkedinmail