The Backyard Quarry, Part 5: Digital Twins for Physical Objects

At this point in the Backyard Quarry project, something subtle has happened.

We started with a pile of rocks.

We now have:

  • a schema
  • a capture process
  • stored images
  • searchable metadata
  • classification
  • lifecycle states

Each rock has a record.

Each record represents something in the physical world.

And that leads to a useful observation.

We’re no longer just cataloging rocks.

We’re building digital representations of them.

What Is a Digital Twin?

In simple terms, a digital twin is:

A structured digital representation of a physical object.

That representation can include:

  • identity
  • properties
  • visual data
  • state
  • history

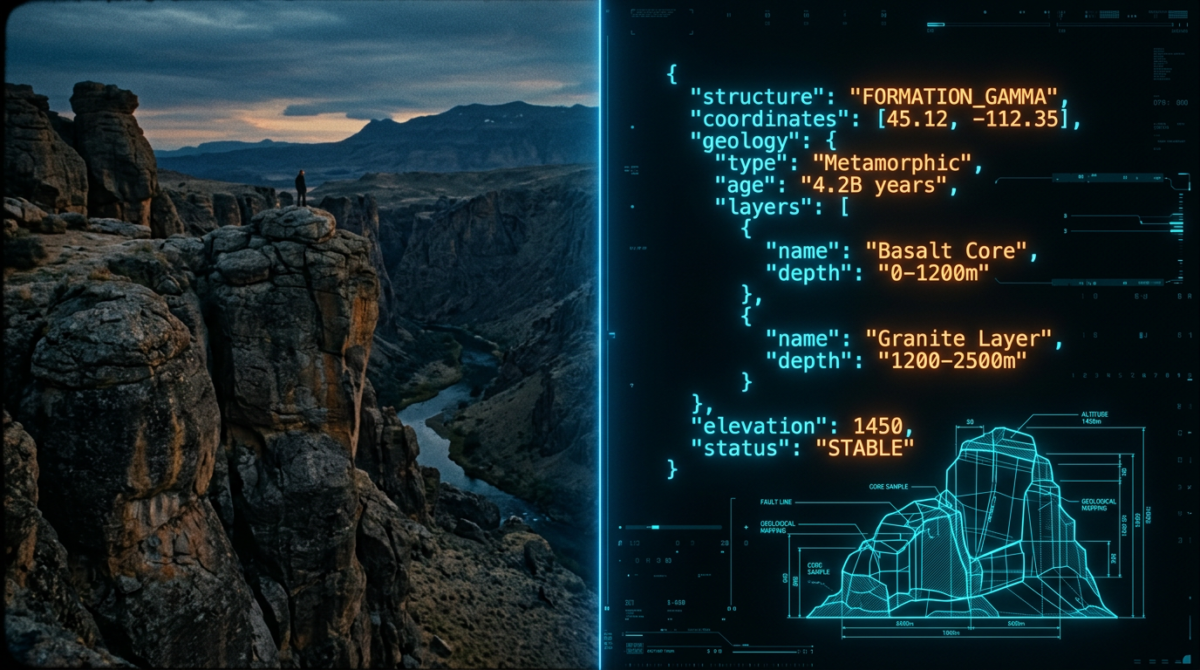
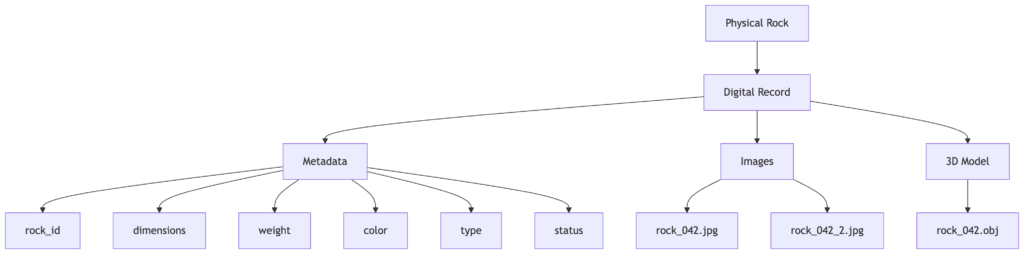
In the context of the Quarry, a rock’s digital twin might look like:

rock_id: QRY-042
weight_lb: 12.3
dimensions_cm: 18 x 10 x 7
color: gray
rock_type: granite
status: for_sale
images: [rock_042_1.jpg, rock_042_2.jpg]
model: rock_042.obj

It’s not the rock itself.

But it’s a useful abstraction of it.

More Than Just Metadata

At first glance, a digital twin might look like a simple database record.

But there’s an important difference.

A well-designed digital twin combines multiple types of data:

  • structured metadata (easy to query)
  • unstructured assets (images, models)
  • derived attributes (classification, embeddings)
  • state over time

It’s not just describing the object.

It’s enabling interaction with it through software.

The Time Dimension

One of the most important aspects of a digital twin is that it can change over time.

Even a rock — which is about as static as objects get — has a lifecycle in the system:

collected → cataloged → listed_for_sale → sold

Each transition adds context.

Now we’re not just storing a snapshot.

We’re tracking a history.

This becomes much more important in other domains.

Where This Shows Up

The interesting part is that this pattern isn’t unique to rocks.

It appears in many different systems.

Manufacturing

  • digital twins of machine parts
  • tracking condition and usage
  • linking physical components to system data

Museums and Archives

  • artifacts with metadata, images, provenance
  • digitized collections
  • searchable historical records

Agriculture

  • crops tracked over time
  • environmental data
  • growth and yield metrics

Healthcare and Motion

  • human movement captured as data
  • gait analysis
  • rehabilitation tracking

This last one starts to look a lot like something else entirely.

From Objects to Systems

What the Backyard Quarry demonstrates, in a small way, is that once you:

  • represent objects as data
  • capture their properties
  • store and index them

you’ve created the foundation for a larger system.

The digital twin becomes a building block.

And systems are built from collections of these building blocks.

The Abstraction Layer

A useful way to think about digital twins is as an abstraction layer.

They sit between:

Diagram showing how physical objects are captured and represented as digital twins with metadata, assets, and application layers.
Digital twins act as a bridge between physical objects and software systems.

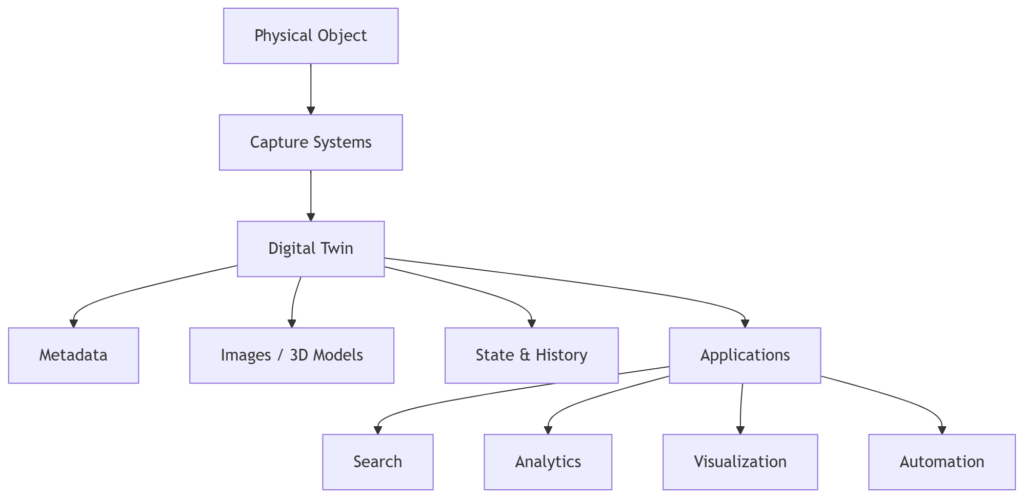
Applications don’t interact with rocks directly.

They interact with the representation of rocks.

That layer enables:

  • search
  • analytics
  • visualization
  • automation

Without it, everything remains manual and unstructured.

The Limits of the Model

Of course, digital twins are not perfect representations.

They are approximations.

Some properties are easy to capture.

Others are difficult or impossible.

Even in the Quarry:

  • weight is approximate
  • dimensions are imprecise
  • visual data depends on lighting
  • 3D models may be incomplete

The goal isn’t perfect fidelity.

It’s usefulness.

The Real Insight

At this point, the Backyard Quarry starts to feel less like a joke and more like a small version of a much larger idea.

Many modern systems are built around digital twins.

Not because the concept is new.

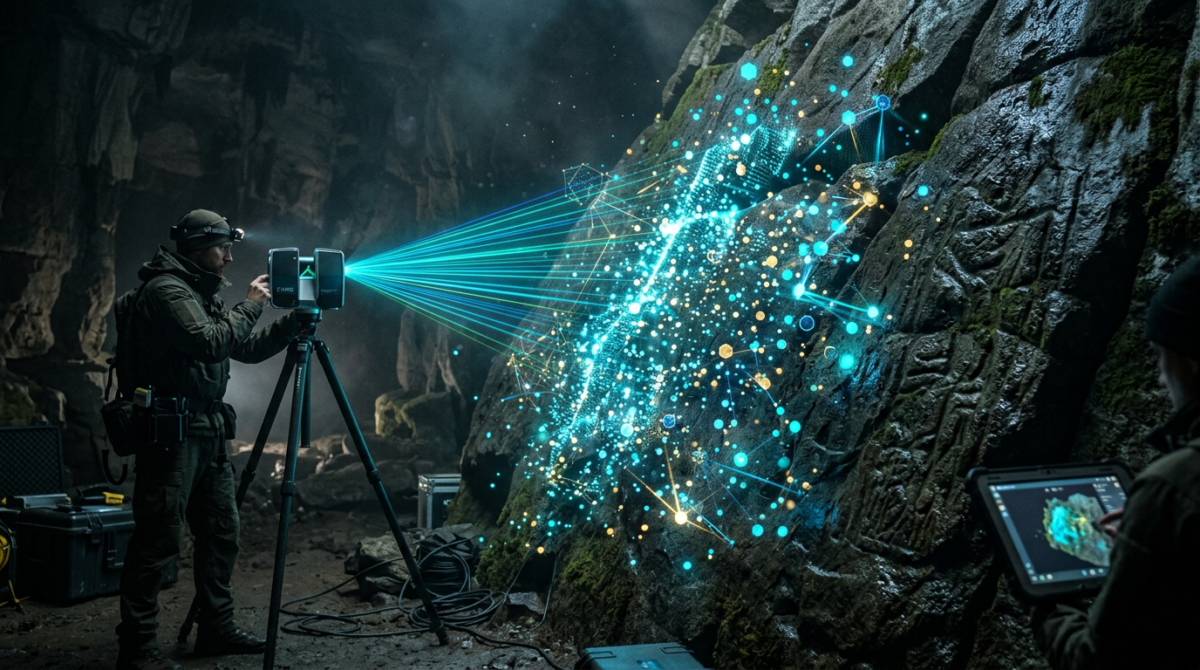
But because we now have the tools to make it practical:

  • cheap sensors
  • high-resolution cameras
  • scalable storage
  • machine learning

The pattern has existed for a long time.

The difference is that we can now implement it at scale.

What Comes Next

So far, the Quarry system works at a small scale.

A handful of rocks.

A manageable dataset.

But what happens when the number of objects grows?

When the dataset becomes:

  • hundreds
  • thousands
  • or millions

The next post explores that question.

Because designing a system for a small dataset is one thing.

Designing a system that scales is something else entirely.

And somewhere along the way, it becomes clear that a pile of rocks is enough to illustrate ideas that show up across entire industries.

Yet another surprise in this Backyard Quarry journey.

The Rock Quarry Series

Facebooktwitterredditlinkedinmail

The Backyard Quarry, Part 2: Designing a Schema for Physical Objects

In the first post of this series we set the stage for the Backyard Quarry project.

Once you decide every rock in the yard should have a record, the next question appears immediately:

What exactly should we record?

It’s a deceptively simple question. And like most simple questions in engineering, it opens the door to a surprisingly large number of decisions.

The First Attempt

The most straightforward approach is to keep things minimal.

Each rock gets an identifier and a few attributes.

Something like:

rock_id
size
price

At first glance, this seems reasonable.

We can identify the rock. We can describe it in some vague way. We can assign a price.

But this model breaks down almost immediately.

“Size” is ambiguous. Is that weight? Volume? Longest dimension? All of the above?

Two rocks of the same “size” might behave very differently when you try to move them.

And more importantly, this model doesn’t capture anything about the rock beyond its most basic characteristics.

It’s enough to sell a rock.

It’s not enough to understand one.

Expanding the Model

To make the system more useful, we need to be more explicit.

A slightly richer model might look like this:

rock_id
weight_lb
length_cm
width_cm
height_cm
color
rock_type
location_found
status

Now we’re getting somewhere.

We can distinguish between rocks that look similar but behave differently.

We can track where each rock came from.

We can start to answer questions like:

  • How many rocks do we have in a given area?
  • What size distribution does the dataset have?
  • Which rocks are suitable for different uses?

This is the point where the rock pile starts to feel less like a random collection and more like a dataset.

The Object Data Model

At a higher level, what we’re really doing is separating a physical object into a few distinct components.

Diagram showing how a physical rock is represented as a digital record with metadata, images, and a 3D model.
A simple model for representing a physical object as structured data and associated assets.

Each rock has:

  • metadata describing its properties
  • images representing its appearance
  • optionally, a 3D model capturing its shape

This separation turns out to be important.

Metadata is small, structured, and easy to query.

Images and 3D models are large, unstructured assets that need to be stored and referenced.

Keeping those concerns separate is a pattern that shows up in many real-world systems.

The Identity Problem

Once the schema starts to take shape, another question appears.

How do we uniquely identify a rock?

There are a few options:

  • sequential IDs (rock_001, rock_002)
  • UUIDs
  • physical tags attached to rocks
  • some form of image-based identification

For a small backyard dataset, almost anything works.

But the choice matters more as the system grows.

Sequential IDs are easy to read but require coordination.

UUIDs are globally unique but harder to work with manually.

Physical tags introduce a connection between the digital record and the real-world object.

Even in a simple system, identity becomes a design decision.

Classification: The Quarry Taxonomy

At some point, it becomes useful to introduce categories.

Originally this was just a convenience.

But like many things in this project, it quickly became something more formal.

A simple classification system might look like this:

Class 0 — Pebble
Class 1 — Hand Sample
Class 2 — Landscaping Rock
Class 3 — Wheelbarrow Class
Class 4 — Engine Block Class
Class 5 — Heavy Machinery Class

Each class roughly corresponds to how the rock is handled.

This turns out to be surprisingly useful.

Instead of asking for exact dimensions, we can filter by class:

  • “Show me all Pebble Class rocks”
  • “Exclude anything above Wheelbarrow Class”

In other words, we’ve introduced a derived attribute — something computed from the underlying data rather than stored arbitrarily.

This is exactly how classification systems evolve in real datasets.

Thinking About Lifecycle

Rocks don’t change much physically, but their role in the system does.

A rock might move through states like:

collected
cataloged
listed_for_sale
sold

Tracking this lifecycle introduces another dimension to the data.

Now we’re not just modeling objects.

We’re modeling *objects over *.

Even in a simple system, state and transitions begin to matter.

The Tradeoffs

At this point, the schema is already doing useful work.

But it’s also clear that there’s no perfect design.

Every decision involves tradeoffs:

  • more fields vs simplicity
  • normalized structure vs ease of use
  • flexibility vs consistency

The goal isn’t to design the perfect schema on the first try.

The goal is to design something that can evolve.

Because as soon as we start capturing real data, we’ll learn what we got wrong.

What Comes Next

With a basic schema in place, the next challenge becomes obvious.

We know what we want to store.

Now we need to figure out how to capture it.

In the next post, we’ll look at how to turn a physical rock into images, measurements, and potentially a 3D model — and how that process introduces its own set of constraints.

Because it turns out that collecting data from the physical world is rarely as clean as designing a schema on paper.

Facebooktwitterredditlinkedinmail