
(Connecting the Local Twin to the Global Market)
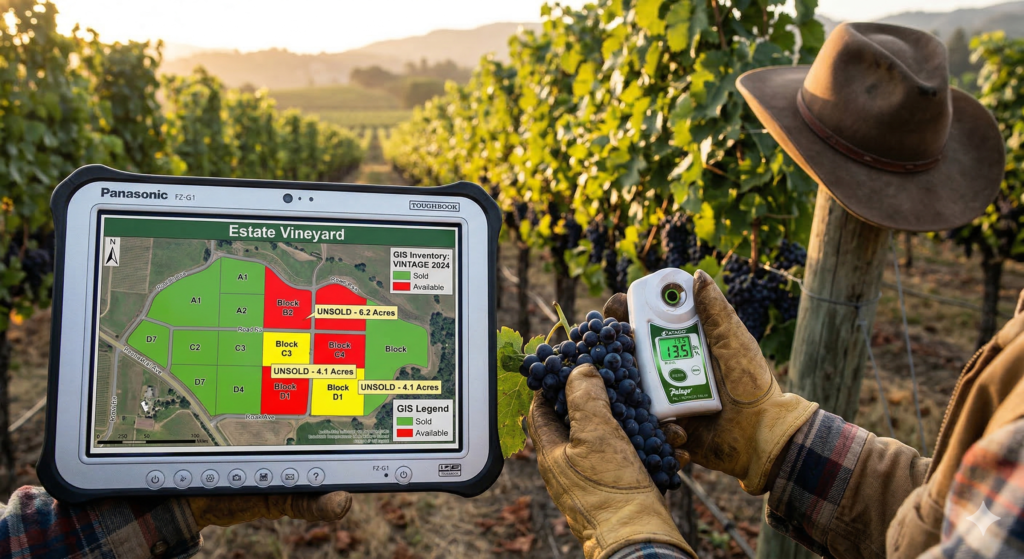
In our last post, we built the “Digital Twin” of the dirt. We gave our vineyard blocks a permanent identity and a way to log real-time sugar and acid levels. But a Digital Twin is just a mirror; to survive a lopsided season, you need an Engine.
The Pivot Engine is the layer of our Sovereign AI that connects your private vineyard data to the public world of commodity prices, weather forecasts, and regional contracts. It moves us from “What is happening?” to “What should I do?”
The Scenario Planner: Beyond the “Hunch”
Every grower has a “gut feeling” about when to hold and when to fold. But when 70% of your crop is unallocated, a “hunch” is a high-stakes gamble. The Pivot Engine uses Scenario Planning to run a “What-If” analysis across your available outlets.
| Feature | Scenario A: The Waiting Game | Scenario B: The Early Exit |
|---|---|---|
| Market | Standard Wine (September) | Culinary Verjus (Now) |
| Risk | High. If no buyer appears, fruit rots. | Zero. The market is buying today. |
| Potential | $2,200 / ton | $750 / ton |
| Labor | Full season (spraying, canopy) | Minimal (harvest during green drop) |
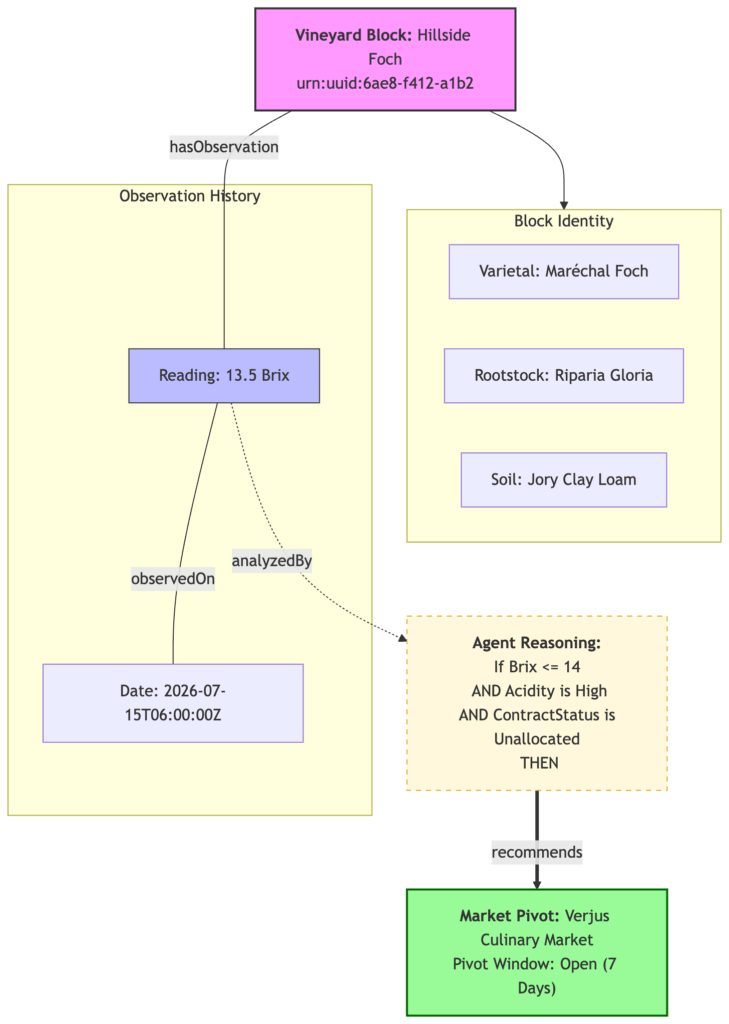
The Engine in Action: The “Heatwave” Logic
What the Pivot Engine actually does isn’t just store data.
It holds context.
It knows your sugar levels, it knows the market price, and it’s watching the clouds.
The Sunday Morning Exchange:
Farmer: “Scribe, the Riesling block is at 14 Brix. We still don’t have a winery contract for those 20 tons. What are we looking at?”
Field Agent: “I’ve analyzed the two most viable paths. Path A is holding for a late-harvest wine contract. Path B is a pivot to Verjus. Current regional spot prices for Verjus base-wine are holding at $750/ton.”
Farmer: “What’s the weather look like for that pivot?”
Field Agent: “That’s the trigger. The Farmer’s Almanac and local sensors predict a three-day heat spike starting Wednesday. At current temperatures, your acidity will drop and sugars will spike. The Verjus Window for this Riesling block will effectively close in 96 hours.”
Farmer: “And if we hold for wine?”
Field Agent: “If we hold, we’re committed to another 8 weeks of canopy management and bird netting. If no buyer is found by late August, your ROI drops to zero. Pivoting now secures a guaranteed $15,000 for fruit we were otherwise going to drop to the ground.”
The Market Scraper: How the Agent “Knows”
In a Sovereign system, we don’t rely on a mysterious “Market Insight” button from a big-tech provider. Instead, we use Market Scrapers, specialized tools we build that allow the AI to query the world on your behalf.
The Agent isn’t just Googling; it’s checking the specific “Spot Prices” you care about, from USDA Specialty Crop reports to regional Custom Crush exchange boards. Because this tool lives on your hardware, it uses your specific contract thresholds and your risk tolerance. You aren’t being squeezed into a global average; you’re being optimized for your specific rows.
The Road Ahead
The Pivot Engine helps us decide where the fruit goes. Next, we have to deal with the logistics of moving it. In our next post, we’ll look at the Supply Chain Guardian and how we use the Knowledge Graph to track the fruit from the vine to the press, ensuring that every gallon of “Pivot” product is accounted for and verified.
##The Agile Harvest Series
- The Scribe’s Day Off: From 1880 Archives to 2026 Vines
- The Field Agent: Identity and the Digital Twin of the Dirt
Are you struggling with the gap between what you’ve grown and what you’ve actually sold? How are you running your “What-If” scenarios this season? Reach out on LinkedIn and let’s talk about building a Pivot Engine for your rows.