
What a little pitch-tracking app saw in the 2026 World Series.
October baseball is a different sport wearing the same uniforms.
In July, a starter gets six innings and a long leash. In October, he gets a hook the moment the third time through the order looks shaky. Aces pitch on short rest. Relievers who were anonymous in June become household names in a week. Managers who spent the summer saving arms spend the fall burning them, because there is no tomorrow to save them for.
Which makes October the most interesting month of the year to watch pitchers. So this year, I watched them twice: once on the couch, and once through a small app I built early this 2026 season to keep tabs on what starters were throwing.
The Brewers won it in five. What the app saw along the way was not quite the Series I thought I was watching.
The app, briefly
It’s a modest thing. You give it a date range, and it pulls every pitch from Statcast, MLB’s pitch-tracking system, figures out who started each game, and shows what those starters threw: pitch mix, velocity, spin, where the pitches crossed the plate, and how often hitters swung through them.
The hosted version caps requests at 14 days so it doesn’t fall over on a free server. That limit turns out to be perfect for this, because an entire World Series fits inside it. Every number in this post came from typing the Series dates into the demo and pressing a button, and you can do the same thing and check my work.
How I’m keeping score
ERA is a lousy stat for a seven-game series. One bad inning can wreck it, and a starter might only make two starts. So for ranking who pitched well, the app uses CSW%: the share of a pitcher’s pitches that end in a called strike or a swing and miss.
It’s a simple idea. A pitch the umpire calls a strike, or one the hitter flails at and misses, is a pitch the pitcher won. A starter who wins a third of his pitches is having a very good night. League average usually lands somewhere in the high twenties.
To keep a pitcher with ten great pitches from topping the list, a starter needs at least 75 pitches across his Series starts to qualify. That’s roughly one full start, and in October, it turns out not everyone gets one.
I should admit something about that number before we go any further, because it shaped everything the app told me.
Seventy-five pitches is not a neutral choice. It’s a number I picked because of the pitchers I grew up watching. Nolan Ryan. Randy Johnson. Tom Glavine. Greg Maddux. Starters who expected to be in the game in the seventh inning and were mildly insulted when they weren’t. The term “Maddux,” for a complete-game shutout thrown in under 100 pitches, exists because one man did it often enough that we needed a word for it.
So when I wrote “at least 75 pitches in his starts” into the code, I wasn’t defining a starter. I was defining the kind of starter I was looking for. The app has been quietly asking a 1995 question of a 2026 game ever since, and the 2026 game kept declining to answer it.
More on that below, because it turned out to be the most interesting thing in the data.
My predictions, written before Game 1
These went up in a separate post before the first pitch, so I couldn’t quietly edit them afterward.
- The CSW leader will clear 32%. The Series’ most effective qualifying starter, using the 75-pitch minimum, will finish with a CSW% of at least 32%.
- At least one starter won’t qualify. At least one pitcher who starts a World Series game will finish the Series with fewer than 75 pitches thrown as a starter.
- A rematch will produce a different arsenal. At least one starter making two Series starts will change the usage rate of one pitch type by 15 percentage points or more between appearances.
- Misiorowski will reach 105. Jacob Misiorowski will throw at least one pitch of 105 mph or faster in the Series, per Statcast.
- Freddy Peralta won’t lead the CSW rankings. Despite his ALCS MVP performance, Peralta will not finish as the World Series’ highest-CSW qualifying starter.
The most effective starter of the Series
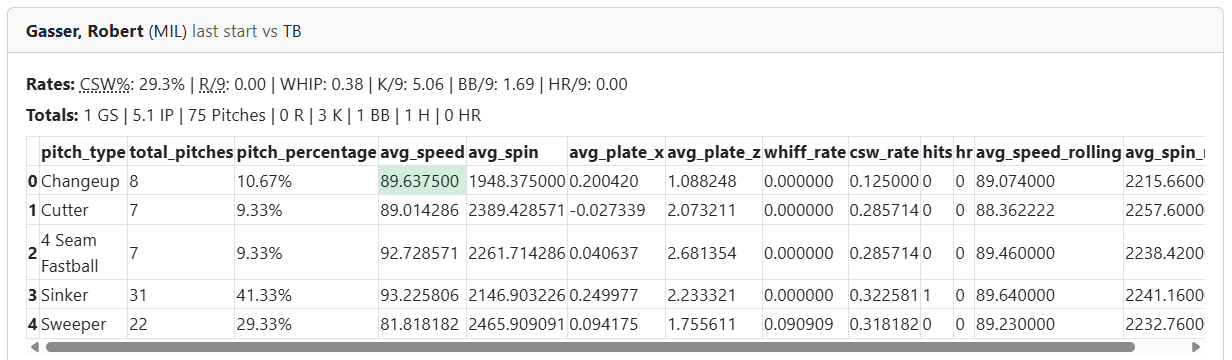
Robert Gasser, Milwaukee. 29.3% CSW, Game 3, 75 pitches.
Seventy-five. Exactly seventy-five. The most effective starter in the 2026 World Series cleared my qualifying threshold by zero pitches. One fewer and the app would have thrown away the best performance it measured.
The line was excellent: 5.1 innings, one hit, one walk, three strikeouts, no runs, an 0.38 WHIP. But the pitch-level data is where it gets strange.
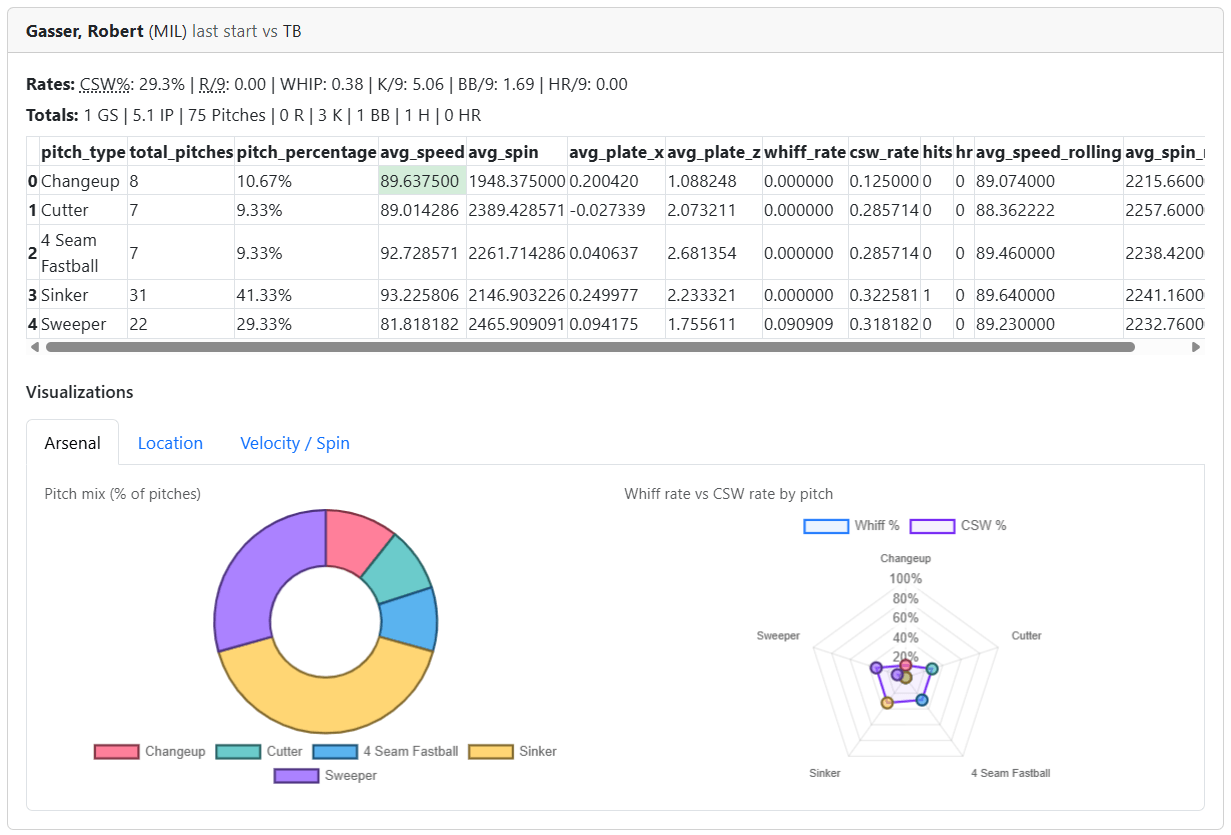
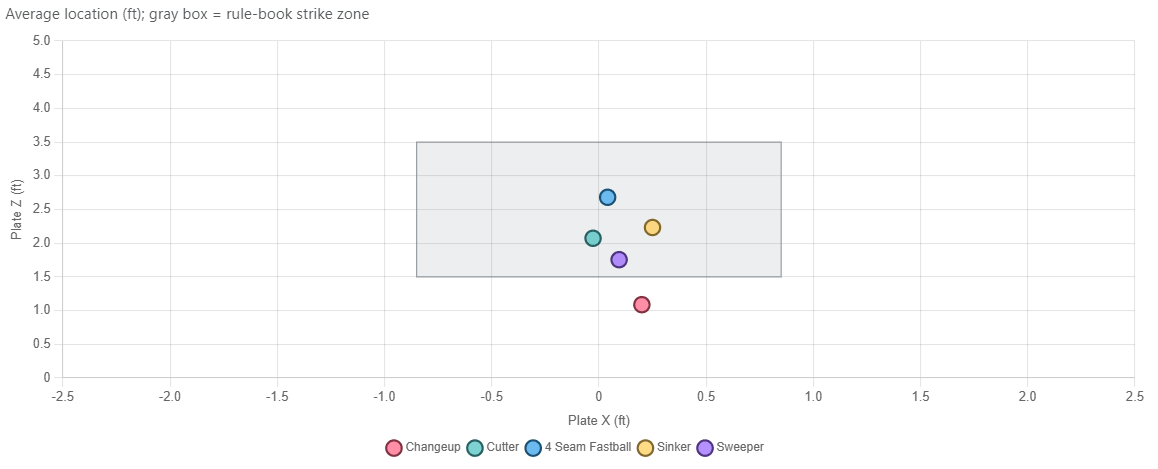
Gasser threw a 93 mph sinker 41% of the time and an 82 mph sweeper 29% of the time, and leaned on that pair for 70% of his night. The sinker produced a 32.3% CSW. The sweeper, 31.8%. Both comfortably above what anyone else managed.
Here’s the part I had to check twice. Across all 75 pitches, Gasser generated two swinging strikes. Both on the sweeper. His changeup, his cutter, his four-seam, and his sinker, 53 pitches between them, produced zero whiffs.
He led the World Series in a swing-and-miss-adjacent statistic by almost never making anyone miss. Twenty of his twenty-two CSW events were called strikes. He threw an 82 mph breaking ball and a 93 mph sinker at the edges of the zone, umpires kept raising a hand, and Tampa Bay never squared him up.
That isn’t what I expected the leaderboard to look like. It is, however, an extremely Glavine way to spend an evening.
The one who had to grind
Drew Rasmussen, Tampa Bay. 22.5% CSW, 89 pitches, 3.2 innings.
In Game 2, Rasmussen threw more pitches in a single start than anyone else managed all Series and recorded the fewest outs while doing it: eleven. Eighty-nine pitches for eleven outs is 8.1 pitches per out, and the damage followed, with three runs, six hits, two walks, and a 7.36 R/9.
Easy to file that as a bad night and move on. The pitch data says something more interesting.
Rasmussen’s four-seam fastball generated a 17.6% whiff rate, the highest of any pitch thrown by any qualifying starter in the entire Series. His cutter posted a 28.6% CSW. The stuff was not the problem. He threw five different pitch types, and the two that worked couldn’t carry the three that didn’t: his changeup produced a 13.3% CSW, his sinker 16.7%, and his lone curveball was taken for a ball.
This is the fun part of a stat like CSW%: it measures how often a pitcher won the individual battle, not whether the scoreboard cooperated. A pitcher can lose a lot of battles and still win the war, or win the battles and lose the game on one bad hop. Rasmussen owned the single best swing-and-miss pitch in the World Series and finished last among the men the app would rank.
And then he came back out for Game 5.
On three days’ rest, four days after throwing 89 pitches for eleven outs, Rasmussen gave Tampa Bay four innings on 48 pitches. That is four pitches per out, against 8.1 in Game 2. He cut his workload per out in half, on less rest than a starter is supposed to need.
It is, by that measure, the most efficient start anyone made in the 2026 World Series. The app will not rank it, because 48 pitches does not clear my threshold. More on that in a moment.
The workhorse, and the pitchers the app couldn’t rank
The app shows how many pitches each starter threw, and in October that number is its own story.
The Series workhorse was Jacob Misiorowski, with 165 pitches across two starts, 79 in Game 1 and 86 in Game 5. Rasmussen was next with 137, also across two. Nobody else got a second start, and no single start in the entire Series reached 90 pitches.
And now the number that reframed this entire project.
Five games. Ten starting assignments. Five of them reached 75 pitches.
Half the men who threw the first pitch of a World Series game did not throw enough pitches for my app to have an opinion about them. Game 4 is the clean example: Tampa Bay won it in twelve innings, and neither starter qualified. Rasmussen’s Game 5, the most efficient start of the Series, did not qualify either. Forty-eight pitches is not enough to count as a start, according to me.
The app reported none of this. It printed “Most Effective: 4 Starters,” then later “Most Effective: 1 Starters,” and said nothing at all about the ones it had silently discarded. I had to notice the missing cards myself.
That’s a design failure, and it’s mine. A filter that excludes half its population while displaying only the survivors isn’t reporting a result, it’s hiding one. The fix is a line of text: 4 qualifying of 10 starters. I’ve got an issue open to add the count, to make the pitch minimum a form field instead of a constant buried in the code, and to go back to ranking everyone who threw the first pitch of a game.
Because here’s the thing I had backwards. I thought the 75-pitch floor was a sample-size guard, a way to stop a six-pitch opener from topping the leaderboard. It is that. But it’s also a definition, and I wrote it in the image of pitchers who retired before most of this roster was born. The sport didn’t stop producing starters. It stopped producing the specific kind of starter my code was built to recognize.
There are at least three defensible definitions sitting in the same Statcast rows. Whoever threw the first pitch, which is MLB’s. Whoever threw 75 or more, which is mine. And whoever the team actually planned to carry into the sixth inning, which nobody records anywhere. Those produce three different leaderboards from identical data, and the gap between them is the real story of modern pitching.
The pitch of the Series
Across every qualifying starter, the highest whiff rate belonged to Drew Rasmussen’s four-seam fastball: 17.6% on 34 pitches, averaging 96.4 mph.
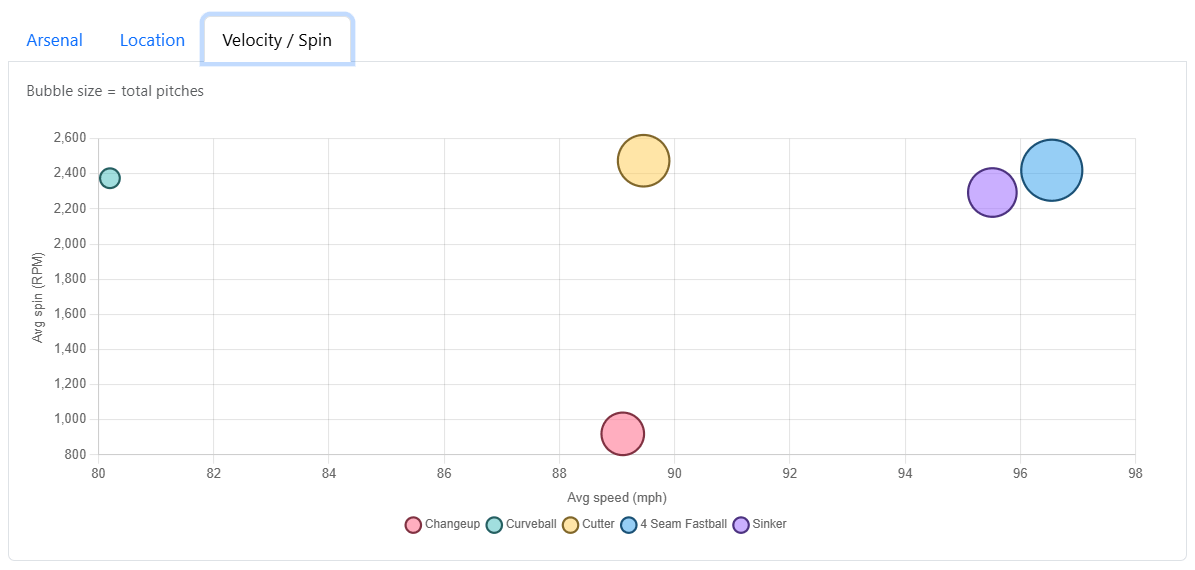
A note on how I got there, because the raw leaderboard lies. Peralta threw exactly two sweepers in the Series and got a whiff on one of them, which the app dutifully records as a 50% whiff rate. Misiorowski’s Game 1 curveball shows 16.7% on six pitches. Neither is a finding. Both are small numbers wearing a percentage sign. Applying a 15-pitch floor to individual pitch types leaves Rasmussen’s fastball on top, with Misiorowski’s Game 5 cutter second at 12.5% and Peralta’s changeup third at 12.0%.
There’s something a little poetic about the Series’ best swing-and-miss pitch belonging to its least effective qualifying starter. Stuff is not the same thing as pitching. It never was.
Did anyone change the plan?
A World Series is the one place a starter faces the same lineup twice in about a week. I wondered whether anyone would come back with a different game plan for the rematch.
The Series gave me two testable cases, and they are the two men who started Game 5. Misiorowski faced the Rays lineup in Game 1 and Game 5. Rasmussen faced the Brewers lineup in Game 2 and Game 5.
The app answers the question without any new features: run it on each start’s date separately and compare the pitch mix.
Jacob Misiorowski 2026 World Series
| Pitch | Game 1 | Game 5 | Change |
|---|---|---|---|
| 4-Seam Fastball | 60.8% | 66.3% | +5.5 |
| Cutter | 21.5% | 18.6% | -2.9 |
| Slider | 8.9% | 8.1% | -0.7 |
| Curveball | 7.6% | 7.0% | -0.6 |
He didn’t change the plan. He threw the same four-pitch distribution twice, leaning slightly harder on the fastball the second time. The largest move in his arsenal was five and a half percentage points.
And then there’s this. His four-seam averaged 101.083 mph in Game 1 and 101.081 mph in Game 5. Two starts, six days apart, 105 fastballs between them, and the averages differ by two thousandths of a mile per hour. I have no lesson to draw from that. I just think it’s one of the more remarkable things I’ve ever pulled out of a dataset.
Rasmussen is the harder case, and the app makes it harder than it needs to be. His Game 5 came in at 48 pitches, under the qualifying minimum, so he vanishes from the Game 5 leaderboard entirely. The pitch-by-pitch data for that start exists, sitting in the same Statcast rows as everything else in this post, and my own filter is the only reason I can’t put it in a table next to his Game 2. That is the threshold problem biting a second time, on the one comparison I most wanted to make.
What Misiorowski learned between starts
The two Misiorowski starts are nearly identical on the arsenal chart. They are not identical at all on the scoreboard, and the difference is the best thing I took away from this Series.
| Game 1 | Game 5 | |
|---|---|---|
| Pitches | 79 | 86 |
| Innings | 4.1 | 5.2 |
| Strikeouts | 3 | 2 |
| Runs | 1 | 0 |
| CSW% | 26.6% | 29.1% |
| Pitches per inning | 18.2 | 15.2 |
Game 5 was his best start of the Series by every measure except the one people look at first. He won more individual pitches, worked an inning and a third deeper, allowed nothing, and struck out fewer people.
He’s 24 years old. This season he threw harder than any starter in recorded history, led the majors with 252 strikeouts, and spent the summer in double digits more often than not. The 105 mph fastball I bet on is a real thing he does.
In Game 5 he got two strikeouts and was close to unhittable anyway, because a pop fly and a ground out retire a hitter exactly as thoroughly as a strikeout does, at roughly a third of the pitch cost. Eighteen pitches an inning gets you pulled in the fifth. Fifteen gets you into the sixth. That is the entire difference between the two starts.
I hope somebody in that clubhouse has already told him. Strikeouts are the most fun outs in baseball and the most expensive, and the pitchers who lasted into the eighth inning in the era I grew up on weren’t the ones collecting the most of them. Greg Maddux averaged under six strikeouts per nine innings in several of his best seasons. He was also in the seventh inning on 85 pitches, which is how he got to pitch the seventh.
Misiorowski threw 86 pitches in Game 5 and got 17 outs. That’s the version of him that pitches for fifteen years.
What the app couldn’t see
One honest limitation, and it mattered in this Series.
The app looks at starters. Only starters. Relief appearances are explicitly excluded, even for a pitcher who started another game in the same date range. Which means it watched the 2026 World Series with roughly half the pitching staff edited out of the picture.
Both closers were excellent, and both earned their innings. Tampa Bay’s trouble wasn’t at the back of the bullpen but in the middle of it, in those sixth and seventh inning handoffs where a two-run lead quietly becomes a problem. If you want to understand how the Brewers won this Series, the gap between the two middle-relief corps belongs in that conversation, and I can’t show it to you with a single screenshot.
That’s not false modesty about a side project. It’s the same point as the 75-pitch threshold. I built a tool around a mental model of baseball where the starter is the story and the bullpen is what happens after the story ends. October 2026 does not work that way. The tool is going to need a different shape next season, and I’ve got a list.
Grading my predictions
Two right, three wrong. The wrong ones were more interesting, which is usually how this goes.
1. The CSW leader will clear 32%. WRONG. Gasser led at 29.3%. Nobody came close to 32%, and the entire qualifying field topped out under 30%. I expected a dominant Series from somebody and got a well-pitched one from several people.
2. At least one starter won’t qualify. RIGHT, and more emphatically than I meant it. I was imagining an opener, or one early hook in a big spot. Five of ten starting assignments came in under 75 pitches. I predicted an exception and got a coin flip.
3. A rematch will produce a different arsenal. WRONG, at least on the half of it I can measure. Misiorowski’s biggest change between Game 1 and Game 5 was 5.5 percentage points on his fastball, nowhere near the 15 I called for. Rasmussen’s second start fell below my own pitch minimum, so the app declines to grade the other case at all. And I nearly didn’t get to grade either one. The prediction quietly required a Series long enough for somebody to start twice, which I didn’t notice when I wrote it. Through four games it looked unresolvable. A twelve-inning Rays win in Game 4 is the only reason it has an answer.
4. Misiorowski will reach 105. WRONG, in the most entertaining way available. He opened Game 1 with a 103.5 mph fastball to Yandy Díaz, the fastest pitch ever thrown in a World Series since tracking began in 2008, breaking Aroldis Chapman’s 103.2 from 2016 and obliterating the previous mark for a starter, Noah Syndergaard’s 101.1 from 2015. He threw 30 pitches at 101 or better that night. The stadium board read 103.4 and Statcast read 103.5, which is its own small lesson about which instrument you believe. And the pitch sailed high for ball one. I predicted a number and the Series handed me a record instead.
5. Freddy Peralta won’t lead the CSW rankings. RIGHT. He finished third at 26.4%, behind Gasser and Misiorowski, on the strength of a Game 1 start that was the only one he got.
Notice that 1 and 4 failed in the same direction. I overestimated peak velocity and I overestimated aggregate dominance, in a Series where the most effective starter threw an 82 mph sweeper and generated two swinging strikes all night. The man throwing 103 wasn’t the man leading in CSW.
Here is the thing I keep coming back to. Rank every start in this Series by pitches per out and the top three are Rasmussen’s Game 5 at 4.00, Gasser’s Game 3 at 4.69, and Misiorowski’s Game 5 at 5.06. Both Game 5 starters finished in the top three. The hardest thrower in recorded history and a man working on three days’ rest, on the last night of the season, getting outs more cheaply than anyone had managed all week.
From the scoreboard, this looked like a Series the Brewers controlled. From sixty feet, six inches, it looked like five games decided by pitchers who got ahead in the count and let the hitters do the rest, and by the bullpens that came in behind them and that my app never saw.
The old pitchers I built this thing for would have recognized the first half of that sentence. I’m less sure what they’d make of the second.
Built with
- pybaseball, a Python library for pulling Statcast data from Baseball Savant
- pandas for crunching the pitches
- Flask for the web app
- Chart.js for the pitch mix, location, and velocity charts
- Render for free hosting, with a 14-day limit per request that a World Series happens to fit inside
The code is on GitHub, and the demo is live. Put in the Series dates and see what you find. If you spot a pitcher I should have written about, tell me in the comments.
Next season’s list so far: show the excluded count alongside every leaderboard, make the pitch minimum a parameter instead of a constant, rank by whoever actually threw the first pitch, and work out what, if anything, this thing should say about relievers. Suggestions welcome. Apparently I need them.