The 5-Minute “Hello World” Comparison
We’ve spent the last month talking about the End of Glue Code and the Enterprise AI Mesh. But if you’re a developer, you don’t just want to see the blueprint—you want to hold the tools.
Whether you are a TypeScript veteran or a Python enthusiast, building an MCP server is surprisingly simple. Today, we’re going to build the same “Hello World” tool in both languages to show you exactly how the protocol abstracts away the complexity.
1. The TypeScript Approach (Node.js)
TypeScript is the “native” language of the Model Context Protocol, and the @modelcontextprotocol/sdk is exceptionally robust for high-performance enterprise tools.
Prerequisites:
npm install @modelcontextprotocol/sdk zod
The Code:
import { Server } from "@modelcontextprotocol/sdk/server/index.js";
import { StdioServerTransport } from "@modelcontextprotocol/sdk/server/stdio.js";
import { z } from "zod";

const server = new Server({
  name: "hello-world-server",
  version: "1.0.0",
}, {
  capabilities: { tools: {} }
});

// Define a simple greeting tool
server.tool(
  "greet_user",
  { name: z.string().describe("The name of the person to greet") },
  async ({ name }) => {
    return {
      content: [{ type: "text", text: `Hello, ${name}! Welcome to the MCP Mesh.` }]
    };
  }
);

async function main() {
  const transport = new StdioServerTransport();
  await server.connect(transport);
}

main().catch(console.error);
2. The Python Approach
For data scientists and AI engineers, the Python SDK offers a beautifully decorative approach. It feels more “agent-native” and integrates seamlessly with existing AI libraries.
Prerequisites:
pip install mcp
The Code:
import asyncio
from mcp.server.fastmcp import FastMCP

# Initialize FastMCP - the "Quick Start" wrapper
mcp = FastMCP("HelloWorld")

@mcp.tool()
async def greet_user(name: str) -> str:
    """Greets a user by name."""
    return f"Hello, {name}! Welcome to the MCP Mesh."

if __name__ == "__main__":
    mcp.run(transport='stdio')
Side-by-Side: Which Should You Choose?
| Feature | TypeScript (Standard SDK) | Python (FastMCP) |
|---|---|---|
| Best For | High-performance, Type-safe tools | Rapid prototyping, AI logic |
| Validation | Zod (Explicit & Strict) | Pydantic / Type Hints (Implicit) |
| Verbosity | Moderate (Structured) | Minimal (Decorator-based) |
| Transport | STDIO, SSE, Custom | STDIO, SSE |
How to Test Your Server
Once you’ve saved your code, you don’t need a complex frontend to test it. Use the MCP Inspector:
# For TypeScript
npx @modelcontextprotocol/inspector node build/index.js

# For Python
npx @modelcontextprotocol/inspector python your_script.py
This will launch a local web interface where you can perform the “Protocol Handshake” and trigger your tools manually. It’s the best way to verify your “Zero-Glue” infrastructure before connecting it to an agent.
Conclusion
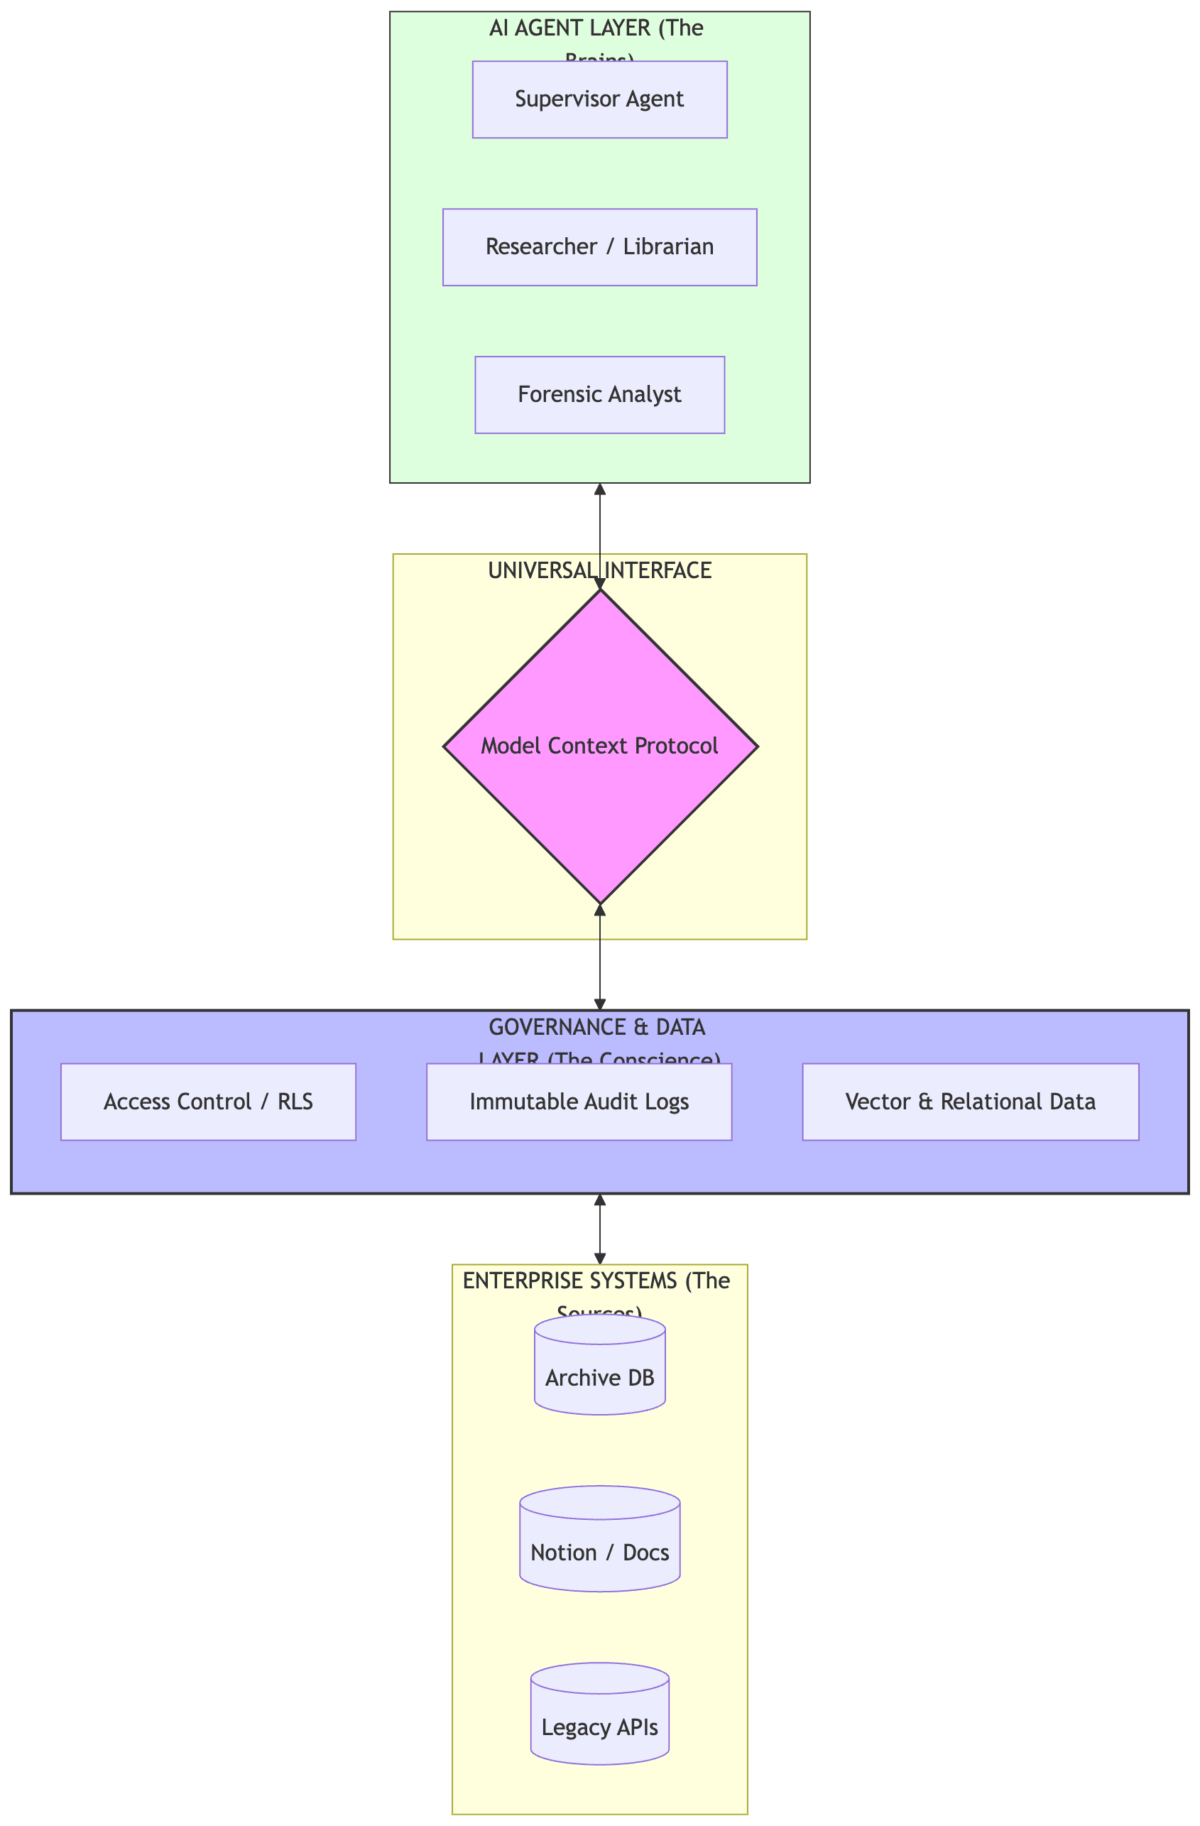
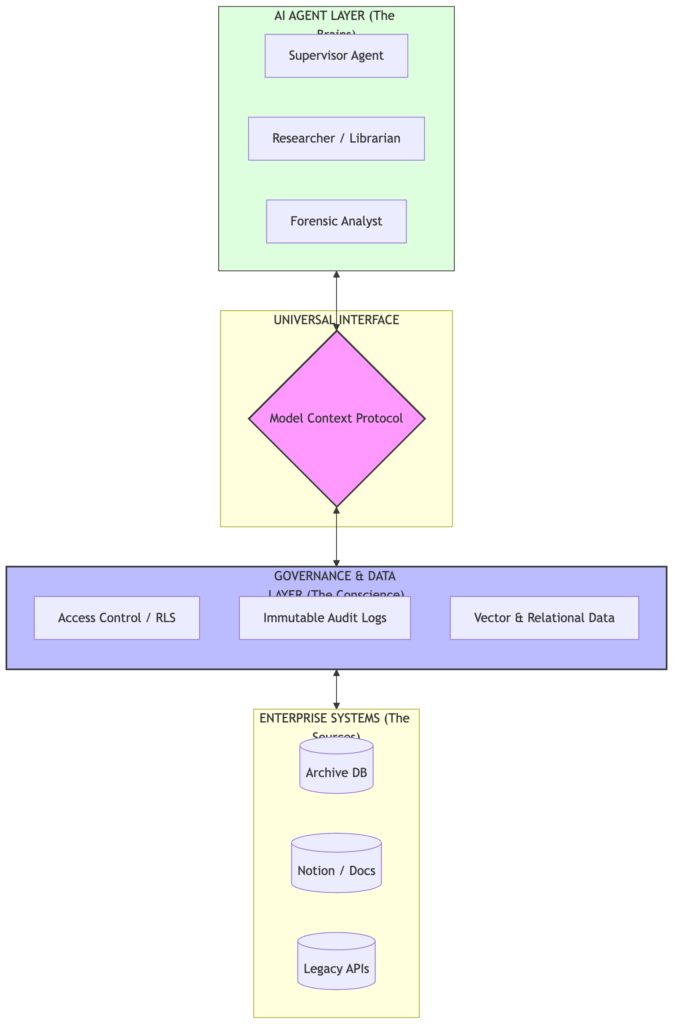
The “Zero-Glue” architecture isn’t about which language you use—it’s about the Protocol. As you can see, the logic for the “Hello World” tool is nearly identical in both versions. The Model Context Protocol ensures that no matter how you build your tools, your agents can discover and use them in a standardized way.
Ready to build your own?
Check out the reference repo for more complex examples, including Notion and Oracle 26ai integrations.
MCP Forensic Analyzer Repository
The “Zero-Glue” Series
- Post 1: The End of Glue Code: Why MCP is the USB-C Moment for AI
- Post 2: The Forensic Team: Architecting Multi-Agent Handoffs
- Post 3: From Cloud to Laptop: Running MCP Agents with SLMs
- Post 4: Enterprise Governance: Scaling MCP with Oracle 26ai
What’s Next?
The Mesh is built.
The agents are ready.
But can you trust them?
In my next series, we explore the ‘Science of Reliability’—building the evaluators that turn AI experiments into production-grade systems.