So far, the Backyard Quarry system has worked well.
We have:
- a schema
- a capture process
- stored assets
- searchable data
- digital twins
For a small dataset, everything feels manageable.
A few rocks here and there.
A handful of records.
It’s easy to reason about the system.
When the Dataset Grows
The moment the dataset starts to grow, the assumptions change.
Instead of a few rocks, imagine:
- hundreds
- thousands
- eventually, many thousands
At that point, a few new questions appear:
- How do we process incoming data efficiently?
- Where do we store large assets?
- How do we keep queries fast?
- What happens when processing takes longer than capture?
These are the same questions that show up in any system dealing with real-world data.
The Pipeline Becomes the System
At small scale, the pipeline is implicit.
You take a photo.
You upload it.
You update a record.
At larger scale, that approach breaks down.
The pipeline becomes explicit.
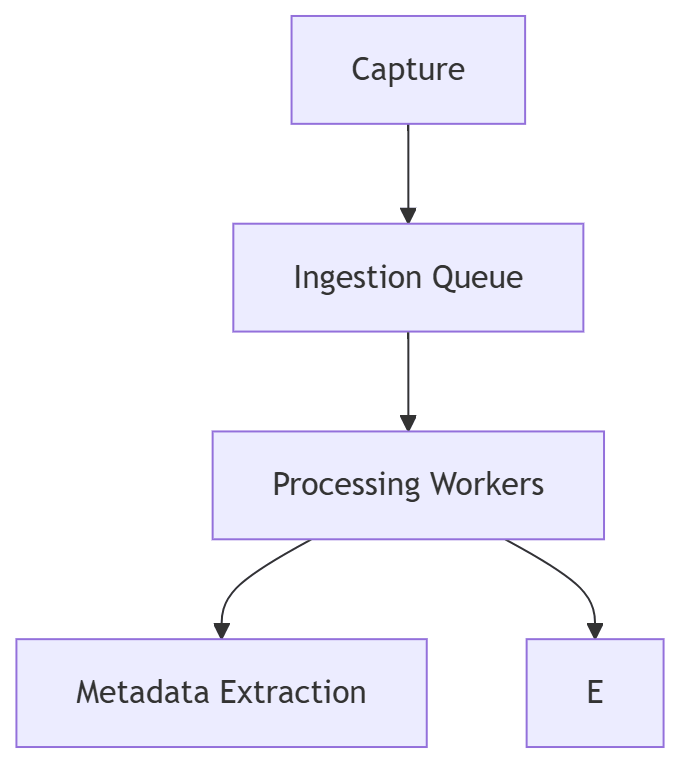
Each stage now has a role:
- capture generates raw input
- ingestion buffers incoming data
- processing transforms it
- storage persists it
- indexing makes it usable
What used to be a simple flow becomes a system of components.
Decoupling the System
One of the first things that happens at scale is decoupling.
Instead of doing everything at once, we separate concerns:
- capture does not block processing
- processing does not block storage
- storage does not block indexing
This introduces queues and asynchronous work.
Instead of:
take photo → process → store → done
we now have:
take photo → enqueue → process later → update system
This improves resilience.
It also introduces complexity.
Storage Starts to Matter
At small scale, storage decisions are easy.
At larger scale, they matter.
We now have different types of data:
- metadata (small, structured)
- images (large, unstructured)
- 3D models (larger, computationally expensive to generate)
These tend to be stored differently:
- database for structured data
- object storage for assets
- references connecting the two
This separation becomes critical for performance and cost.
Processing Becomes a Bottleneck
Not all steps in the pipeline are equal.
Some are fast:
- inserting metadata
- updating records
Others are slow:
- generating 3D models
- running image processing
- extracting features
As the dataset grows, these slower steps become bottlenecks.
Which leads to another pattern:
Parallelization.
Instead of one process handling everything, we distribute the work.
Multiple workers.
Multiple jobs.
Multiple stages running simultaneously.
Indexing at Scale
Search also changes at scale.
At small scale:
- simple queries are fast
- no special indexing required
At larger scale:
- indexes must be built and maintained
- similarity search requires preprocessing
- updates must propagate through the system
Search becomes an active part of the pipeline, not just a query on top of it.
Failure Becomes Normal
At small scale, failures are rare and easy to fix.
At larger scale, failures are expected.
Examples:
- missing images
- failed processing jobs
- incomplete models
- inconsistent metadata
The system must tolerate these failures.
Not eliminate them.
This leads to:
- retries
- partial results
- eventual consistency
In other words, the system becomes more realistic.
A Familiar Architecture
At this point, the Backyard Quarry starts to resemble a typical data platform.
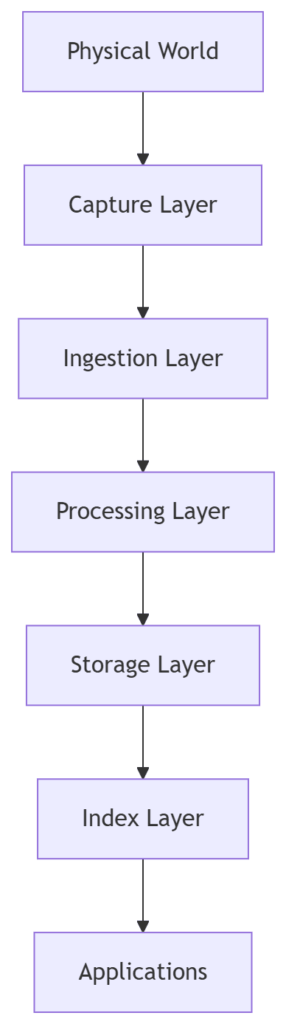
Different domains implement this differently.
But the structure is remarkably consistent.
The Tradeoff
Scaling introduces tradeoffs.
We gain:
- throughput
- flexibility
- resilience
We lose:
- simplicity
- immediacy
- ease of reasoning
What was once a straightforward system becomes a collection of interacting parts.
The Real Shift
The most important change isn’t technical.
It’s conceptual.
At small scale, you think about individual objects.
At larger scale, you think about systems.
You stop asking:
How do I store this rock?
And start asking:
How does the system handle many rocks over time?
That shift is what turns a project into a platform.
What Comes Next
At this point, the Backyard Quarry is no longer just a small experiment.
It’s a miniature version of a data platform.
And the patterns we’ve seen — schema design, pipelines, indexing, scaling — show up in many places.
In the next post, we’ll zoom out even further.
Because once you start recognizing these patterns, you begin to see them everywhere.
Not just in rock piles.
But in systems across industries.
And somewhere along the way, the Quarry stopped being about rocks.
It became about how systems grow.
The Rock Quarry Series
- Turning Rocks into Data
- Designing a Schema for Physical Objects
- Capturing the Physical World
- Searching a Pile of Rocks
- Digital Twins for Physical Objects
- Scaling the Quarry – This Post
- Systems Beyond the Backyard
- From Rocks to Reality