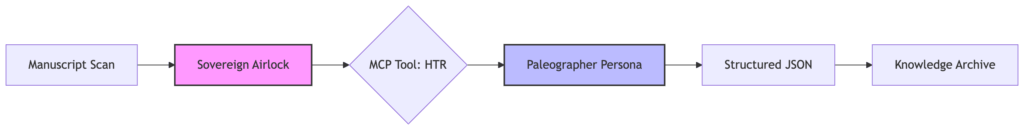

In our last post, we introduced the Digital Scribe, an AI architecture designed to capture the “unstructured nightmare” of historical records. We showed how the Scribe uses the Model Context Protocol (MCP) to transcribe 19th-century cursive and resolve the cryptic “ditto marks” of the past.
But transcription is only half the battle. If the Scribe forgets what it read the moment the session ends, we haven’t built a system; we’ve just built a fancy typewriter.
Today, we go deeper into the Scribe’s Memory.
Memory is an Engineering Discipline
As I’ve written before in Engineering Agent Memory, AI agents are often “stateless by default.” They live in the moment, relying on a flat conversation transcript that grows until it hits a token limit.
For the Digital Scribe, that is unacceptable. To digitize the 1880 Census of Salem, Oregon, we need Semantic Memory, a way to store, index, and retrieve knowledge intentionally.
The Architecture of Persistence: JSON-LD
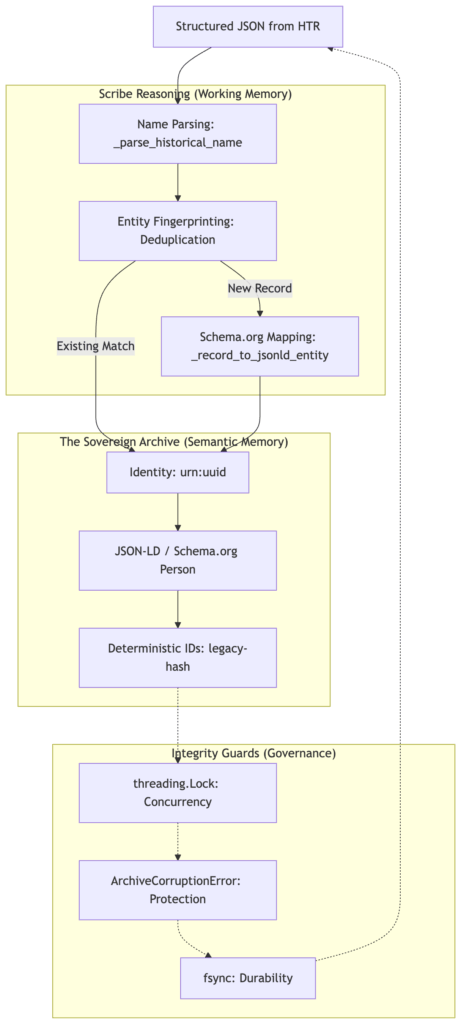
We didn’t just want a text file; we wanted a Sovereign Archive. We chose JSON-LD (JSON for Linked Data) aligned with Schema.org standards. This transforms a census row into a “Thing, not a string.”
To achieve this, we don’t just dump JSON; we map our historical model to the Schema.org Person vocabulary. This ensures that a ‘Scribe’ in 2026 and a researcher in 2050 can both understand that a ‘birthplace’ string is actually a Schema.org/Place entity.
# Mapping the Census to the Global Schema
def _record_to_jsonld_entity(record: Census1880Record, entity_id: str | None = None) -> dict:
    given, family = _parse_historical_name(record.name)
    return {
        "@context": "https://schema.org/",
        "@type": "Person",
        "@id": entity_id or f"urn:uuid:{uuid.uuid4()}",
        "givenName": given,
        "familyName": family,
        "hasOccupation": {"@type": "Occupation", "name": record.occupation},
        "birthPlace": {"@type": "Place", "name": record.birthplace},
        "censusFamilyNumber": record.family_number,
        "censusDwellingNumber": record.dwelling_number,
    }
Technical Deep Dive: Parsing Historical Names
In 1880, names weren’t always “First Last.” We built a robust parser to handle “Surname, Given Name” formats and multi-word surnames. Without this, our “Semantic Memory” would be fractured by simple formatting variances.
| Input String | givenName |
familyName |
|---|---|---|
| “Smith, John” | “John” | “Smith” |
| “Mary Ann Jones” | “Mary Ann” | “Jones” |
| “John Smith” | “John” | “Smith” |
When the Scribe identifies “John Smith” in a ledger, it doesn’t just save a name. It creates a Schema.org/Person entity, complete with a unique urn:uuid: and structured links to his occupation and birthplace.
Atomic Ingestion: Protecting the History
Because we are building “Sovereign Infrastructure,” the integrity of the data is paramount. We implemented an Atomic Write Pattern to ensure the archive is never corrupted.
- Thread-Safety: A global lock ensures that multiple “Scribe” agents don’t collide when writing to the same archive.
- Write-Ahead Strategy: The system writes to a temporary file and uses
os.replaceonly after the data is verified. - Durability: We use
os.fsyncto ensure the data is physically flushed to the disk, protecting against power loss or OS crashes.
By using a write-to-temp pattern followed by an os.fsync, we ensure that the data is physically committed to the platter before we ever swap it into the main archive. This prevents ‘half-written’ files if the power cuts or the process crashes.
# The "Sovereign" Atomic Save
def _save_graph(self, entities: list[dict]) -> None:
    tmp_path = self._path.with_suffix(self._path.suffix + ".tmp")
    replaced = False
    try:
        with open(tmp_path, "w", encoding="utf-8") as f:
            json.dump(entities, f, indent=2, ensure_ascii=False)
            f.write("\n")
            f.flush()
            os.fsync(f.fileno()) # Force the OS to flush to disk
        os.replace(tmp_path, self._path) # Atomic swap
        replaced = True
    finally:
        if not replaced and tmp_path.exists():
            tmp_path.unlink() # Cleanup if we failed
The Recall: Deduplication and Entity Intelligence
The true power of the Scribe’s memory is revealed during Ingestion. If we attempt to capture the same person twice, the Scribe doesn’t just blindly append the data. It performs a Deduplication Check.
By hashing the record’s “DNA” (Name, Dwelling, and Family Number), the Scribe recognizes “John Smith” from a previous run and skips the ingestion, returning a duplicate_skipped status.
Deduplication is the ultimate test of a Scribe’s integrity. We define a unique fingerprint for each life, e.g. a combination of their Name, Dwelling, and Family Number. If the Scribe sees this ‘DNA’ again, it refuses to create a duplicate, maintaining a clean, high-fidelity archive.
# The Knowledge Stewardship Guard
for e in entities:
    if (
        (e.get("givenName") or "") == given
        and (e.get("familyName") or "") == family
        and e.get("censusDwellingNumber") == record.dwelling_number
        and e.get("censusFamilyNumber") == record.family_number
    ):
        # Already exists—identify it and move on
        existing_id = e.get("@id") or f"{LEGACY_ID_PREFIX}{_content_hash(e)}"
        return (existing_id, False)
Why This Matters: Building the Graph
By engineering a persistent, semantic memory, we’ve given the Scribe the ability to recall context across time.
In our next post, we will use this foundation to move from individual residents to The Knowledge Graph. We will begin linking families, neighborhoods, and migration patterns—turning a static archive into a living map of the past.
The Digital Scribe isn’t just reading history anymore. It’s remembering it.