In the previous post, we designed a schema for representing rocks as structured data.
On paper, everything looked clean.
Each rock would have:
- an identifier
- dimensions
- weight
- metadata
- possibly images or even a 3D model
The structure made sense.
The problem was getting the data.
From Schema to Reality
Designing a schema is straightforward.
You can sit down with a notebook or a whiteboard and define exactly what you want the system to store.
Capturing real-world data is a different problem entirely.
The moment you step outside, a few complications become obvious.
Lighting changes.
Objects aren’t uniform.
Measurements are approximate.
And perhaps most importantly:
The dataset doesn’t behave consistently.
The Scale Problem
The Backyard Quarry dataset spans a wide range of sizes:
pea-sized
hand-sized
wheelbarrow-sized
engine-block-sized
That variability immediately affects how data can be captured.
Small rocks can be photographed on a table.
Medium rocks might need to be placed on the ground with careful framing.
Large rocks don’t move easily at all.
Each category introduces different constraints.
This is a pattern that shows up in many real-world systems.
The same pipeline rarely works for every object.
Image Capture
The simplest form of data capture is photography.
Take a few images of each rock from different angles.
Store them.
Attach them to the record.
Even this introduces decisions:
- how many images per object?
- what angles?
- what lighting conditions?
- what background?
Inconsistent capture leads to inconsistent data.
And inconsistent data leads to unreliable systems.
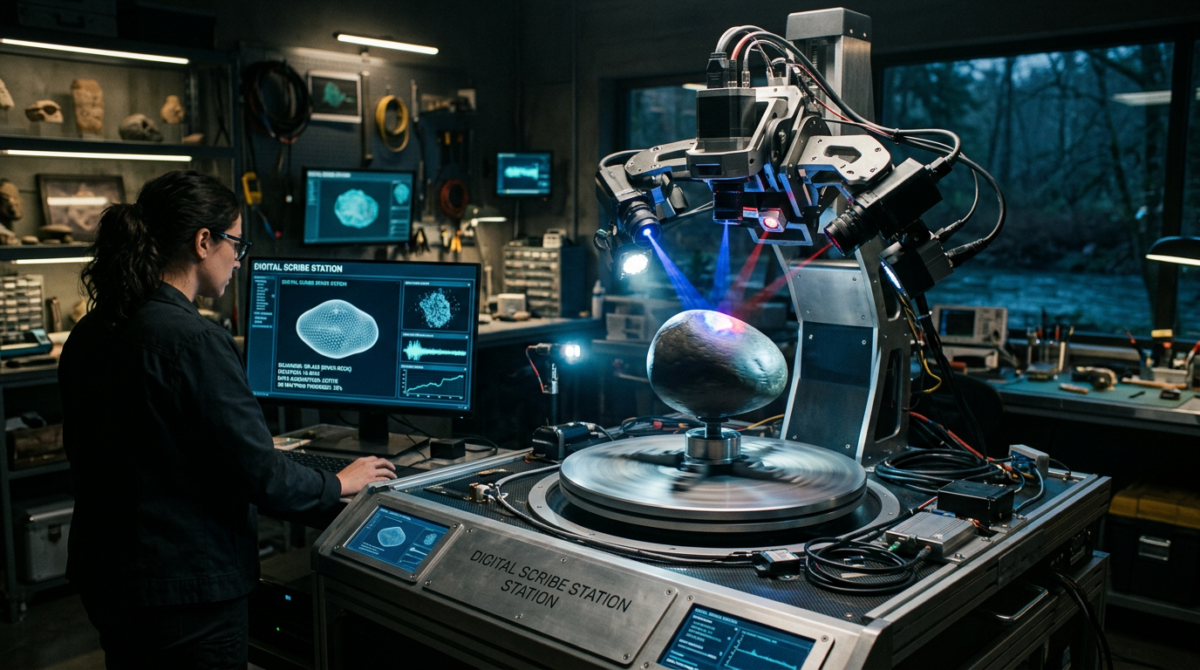
Introducing Photogrammetry
If we take the idea a step further, we can generate a 3D model of each rock.
Photogrammetry works by combining multiple images to reconstruct the shape of an object.
Conceptually:
- take overlapping photos
- feed them into a processing tool
- generate a 3D mesh
This produces a much richer representation than a single image.
But it also introduces:
- processing time
- storage requirements
- failure cases
Not every rock will produce a clean model.
The Capture Pipeline
At this point, the process starts to look like a pipeline.
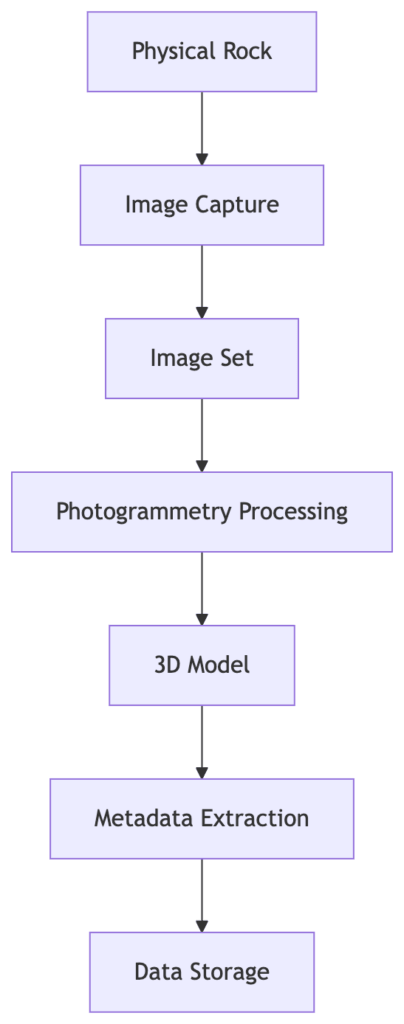
Each step transforms the data in some way.
The output of one stage becomes the input of the next.
This is a common pattern in data engineering.
The difference here is that the input isn’t a clean dataset.
It’s the physical world.
Imperfect Data
No matter how carefully you design the pipeline, real-world data introduces imperfections.
Examples:
- missing images
- inconsistent lighting
- partially occluded objects
- measurement errors
A rock might be:
- too reflective
- too uniform in texture
- partially buried
- awkwardly shaped
All of these affect the output.
This means the system has to tolerate incomplete or imperfect data.
Which leads to an important realization:
Data systems are rarely about perfect data.
They are about handling imperfect data gracefully.
Storage Considerations
Once data is captured, it needs to be stored.
Different types of data behave differently:
- metadata → small, structured, easy to query
- images → larger, unstructured
- 3D models → even larger, more complex
This reinforces a pattern introduced earlier:
Separate structured data from large assets.
Store references rather than embedding everything directly.
A Familiar Pattern
At this point, the Backyard Quarry pipeline looks surprisingly familiar.
It resembles systems used for:
- scanning historical artifacts
- capturing industrial parts
- generating 3D models for manufacturing
- building datasets for computer vision
The specifics change.
The pattern remains the same.
What Comes Next
Once data is captured and stored, the next problem emerges.
How do we find anything?
A dataset of a few rocks is manageable.
A dataset of hundreds or thousands quickly becomes difficult to navigate without structure.
In the next post, we’ll look at how to index and search the dataset — and how even a pile of rocks benefits from thoughtful retrieval systems.
And somewhere along the way, it becomes clear that the hard part isn’t designing the schema.
It’s building systems that can reliably turn messy reality into usable data.
The Rock Quarry Series
- Turning Rocks into Data
- Designing a Schema for Physical Objects
- Capturing the Physical World – This Post
- Searching a Pile of Rocks
- Digital Twins for Physical Objects
- Scaling the Quarry
- Systems Beyond the Backyard
- From Rocks to Reality