The Brewers and the Rays open the World Series on 23 October 2026. Before the first pitch, I’m putting five predictions about the Series’ starting pitching on the record.
Most predictions get forgotten the moment they turn out wrong. These won’t. After the final out, I’ll run every starter’s pitches through a little Statcast app I built and grade each one in public, misses included.
The main stat is CSW%: the share of a pitcher’s pitches that end in a called strike or a swing and miss. A pitch the umpire calls a strike, or one the hitter whiffs on, is a pitch the pitcher won. To be ranked, a starter needs at least 75 pitches across his Series starts.
The predictions
The CSW leader will clear 32%. The Series’ most effective qualifying starter, using the 75-pitch minimum, will finish with a CSW% of at least 32%.
At least one starter won’t qualify. At least one pitcher who starts a World Series game will finish the Series with fewer than 75 pitches thrown as a starter.
A rematch will produce a different arsenal. At least one starter making two Series starts will change the usage rate of one pitch type by 15 percentage points or more between appearances.
Misiorowski will reach 105. Jacob Misiorowski will throw at least one pitch of 105 mph or faster in the Series, per Statcast.
Freddy Peralta won’t lead the CSW rankings. Despite his ALCS MVP performance, Peralta will not finish as the World Series’ highest-CSW qualifying starter.
Two of these I’d bet on, two are coin flips, and one is me hoping for something fun.
Play along
The app is live, and an entire World Series fits inside its 14-day limit, so once the Series is over you can grade these yourself before I do. If you think I’m wrong about any of them, or you have a better prediction, leave it in the comments. Those get graded too.
The full write-up, with the grades, lands after the final out.
Another round of tech layoffs rolled through the industry recently, and I was one of the people caught in it.
If you’ve worked in tech for any length of time, you know the routine that follows. Update the résumé. Reach out to contacts. Scroll job boards. Try to figure out which technologies the market is currently excited about and which ones have quietly drifted into irrelevance.
After a few days of that cycle, I found myself spending more time outside than in front of a laptop.
One afternoon, walking around the yard, I noticed something interesting.
My backyard contains a surprisingly large dataset.
Rocks.
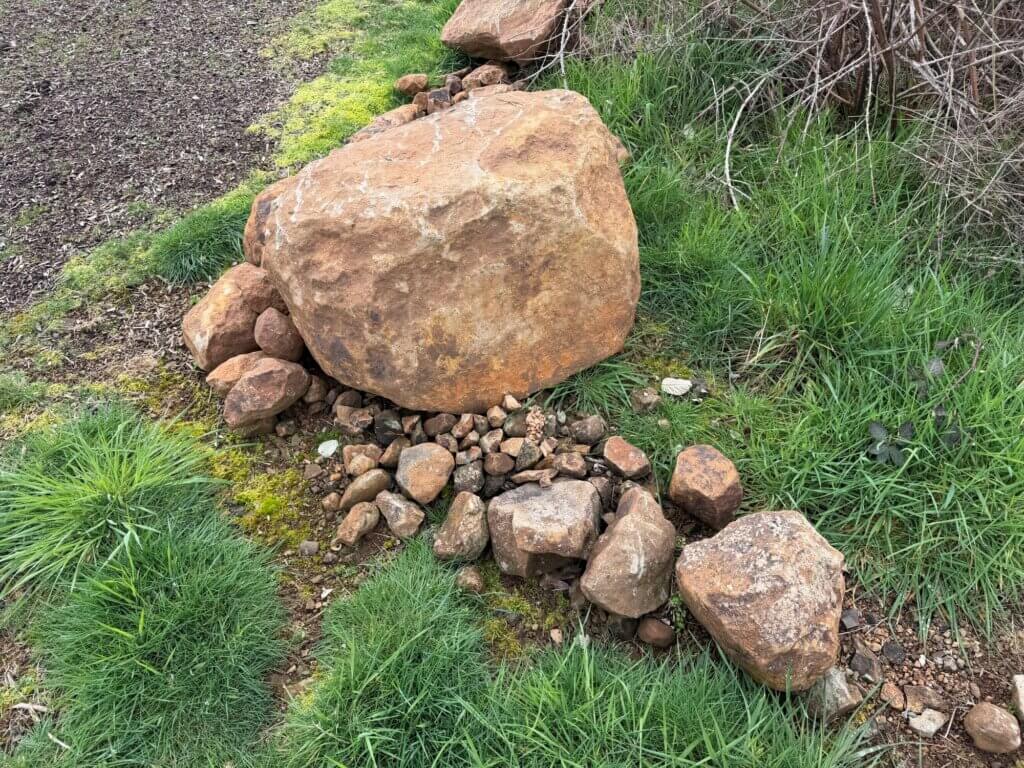
Sample of the rocks from the Backyard Quarry used for the dataset.
Lots of rocks.
Some are the size of peas. Others are roughly the size of a car engine. A few fall somewhere in the unsettling range between “wheelbarrow recommended” and “this probably requires heavy machinery.”
Naturally, I had the same thought many people eventually have when staring at a large pile of rocks:
I could probably sell these.
A small stand near the road. A few piles sorted by size. Maybe a sign that says “Landscaping Rock.” It’s not exactly a venture-backed startup, but stranger side businesses have existed.
Unfortunately, engineers have a well-known weakness.
We rarely do things the simple way.
If I was going to sell rocks, I wasn’t just going to pile them on a table.
I was going to build a system.
The Dataset
The moment you start thinking about the rocks as inventory, a familiar set of questions appears.
How many rocks are there?
What kinds?
Which ones are small decorative stones and which ones fall firmly into what I’ve started calling Engine Block Class?
Like many real-world datasets, this one has significant variability.
Some objects are a few grams. Others weigh enough to require careful lifting technique and a brief internal conversation about life choices.
At a glance, the dataset looks chaotic. But underneath the chaos are patterns.
Different sizes. Different shapes. Different colors. Different geological types. Some rocks are smooth river stones. Others are jagged fragments that look like they escaped from a small landslide.
If you squint a little, you start to see the outlines of something familiar to anyone who works with data systems.
A collection of physical objects that could be represented as structured records.
The Engineer’s Curse
In theory, selling rocks is simple.
Step one: collect rocks.
Step two: put them in a pile.
Step three: wait for someone to stop their car and decide they want landscaping material.
But once you start thinking about it from an engineering perspective, the questions multiply.
Should each rock have an identifier?
Should there be photographs?
Should the system track weight or dimensions?
What about classification?
It’s probably useful to distinguish between Pebble Class rocks and Wheelbarrow Class rocks.
And what about the really large ones — the ones that are clearly in the Engine Block Class, which itself appears to span everything from motorcycle engine scale to something closer to a semi-truck.
Once you start thinking about these questions, the simple rock pile begins to look like something else entirely.
A catalog.
A dataset.
A system waiting to happen.
From Rocks to Records
What if every rock had a record?
Something simple at first.
An identifier. A few attributes. Maybe a photo.
Conceptually, it might look like this:
rock_id
weight
dimensions
color
rock_type
location_found
status
Each rock in the yard becomes a digital object — a structured record representing something in the physical world.
In other words, each rock now has a digital twin.
That might sound slightly ridiculous in the context of landscaping stones, but the idea is surprisingly powerful.
Across many industries, organizations are trying to solve exactly this problem: how to connect messy physical reality with structured digital systems.
Manufacturers track machine parts.
Museums catalog artifacts.
Farmers track crops.
Logistics companies track inventory moving through warehouses.
In each case, the challenge is similar.
A physical object exists somewhere in the world.
We want to represent it in a way that software systems can understand.
The Backyard Quarry
At this point the rock pile had acquired a new name.
The Backyard Quarry.
Partly as a joke, and partly because it captured the spirit of the project. What started as a casual observation had turned into a small experiment in data modeling, object cataloging, and system design.
The dataset might be small.
The objects might be rocks.
But the underlying questions are surprisingly rich.
How do you represent physical objects in software?
How do you capture information about them?
How do you search and organize the resulting data?
And how do these systems scale when the number of objects grows from a few dozen to thousands — or millions?
What Comes Next
Over the next few posts in this series, I’m going to explore those questions by building a small system around the Backyard Quarry.
We’ll look at things like:
designing a schema for physical objects
capturing images and measurements
generating 3D models using photogrammetry
building ingestion pipelines
indexing and searching the dataset
All starting from a simple collection of rocks.
The world has no shortage of complicated engineering problems.
Sometimes the best place to explore them is somewhere simpler.
Like a pile of rocks in the backyard.
And if you happen to need a carefully documented specimen from the Backyard Quarry, inventory is currently available.
Shipping, however, may exceed the value of the rock itself.
Contains information about the traffic source or campaign that directed user to the website. The cookie is set when the GA.js javascript is loaded and updated when data is sent to the Google Anaytics server
6 months after last activity
__utmv
Contains custom information set by the web developer via the _setCustomVar method in Google Analytics. This cookie is updated every time new data is sent to the Google Analytics server.
2 years after last activity
__utmx
Used to determine whether a user is included in an A / B or Multivariate test.
18 months
_ga
ID used to identify users
2 years
_gali
Used by Google Analytics to determine which links on a page are being clicked
30 seconds
_ga_
ID used to identify users
2 years
_gid
ID used to identify users for 24 hours after last activity
24 hours
_gat
Used to monitor number of Google Analytics server requests when using Google Tag Manager
1 minute
_gac_
Contains information related to marketing campaigns of the user. These are shared with Google AdWords / Google Ads when the Google Ads and Google Analytics accounts are linked together.
90 days
__utma
ID used to identify users and sessions
2 years after last activity
__utmt
Used to monitor number of Google Analytics server requests
10 minutes
__utmb
Used to distinguish new sessions and visits. This cookie is set when the GA.js javascript library is loaded and there is no existing __utmb cookie. The cookie is updated every time data is sent to the Google Analytics server.
30 minutes after last activity
__utmc
Used only with old Urchin versions of Google Analytics and not with GA.js. Was used to distinguish between new sessions and visits at the end of a session.
End of session (browser)
Marketing cookies are used to follow visitors to websites. The intention is to show ads that are relevant and engaging to the individual user.
X Pixel enables businesses to track user interactions and optimize ad performance on the X platform effectively.
This cookie is set by X to identify and track the website visitor. Registers if a users is signed in the X platform and collects information about ad preferences.
2 years
personalization_id
Unique value with which users can be identified by X. Collected information is used to be personalize X services, including X trends, stories, ads and suggestions.
2 years
external_referer
Our Website uses X buttons to allow our visitors to follow our promotional X feeds, and sometimes embed feeds on our Website.